


The new INRIX Traffic Scorecard uses "big" data to calculate congestion costs. Like previous studies, it exaggerates traffic congestion costs and roadway expansion benefits.
The newly released INRIX 2016 Traffic Scorecard uses cell phone, vehicle tracking and GPS data to calculate traffic speeds and congestion delays in U.S. cities. But critical analysis by City Observatory researcher Joe Cortright (Yet Another Flawed Congestion Report from Inrix: Big Data Provides Little Insight) challenges the Scorecard's methods and conclusions.
"One one level, its a truly impressive display of big data. Inrix has compiled 500 terabytes of data, for hundreds of thousands of roadway segments, from hundreds of millions of sources on more than a thousand cities around the globe. That’s a real wealth of information. Inrix casually slips in the factoid that average speeds on New York streets are 8.23 mph, versus 11.07 mph and 11.54 mph in L.A. and San Francisco respectively. But unfortunately, in this particular report, it has chosen to process, filter and present this data in a way that chiefly serves to generate heat, rather than shed any light on the nature, causes and solutions to urban traffic problems. If 'big data' and 'smart cities' are really going to amount to anything substantial, it has to be more than just generating high tech scare stories."
Cortright identifies four key problems with the Scorecard:
- Methodology: New and non-comparable, but not significantly different or better
- An unrealistic definition of congestion
- Exaggerating costs
- Ignoring distance, discounting accessibility
FULL STORY: Yet Another Flawed Congestion Report from Inrix. Big Data Provides Little Insight


How Not To Measure Traffic Congestion—Hold the Hyperbole, Please!
The new INRIX congestion costing report is another good example of bad analysis. We just want accurate information; hold the hyperbole, please.
No, Traffic Congestion Does Not Really Cost Every American $1,348 Annually
The INRIX Global Traffic Scorecard exaggerates congestion costs in order to enhance the value of its traffic monitoring services. A little skepticism is justified.

Could Boston Join Seattle in Proposing Congestion Pricing?
The compelling reason behind Boston's looking at congestion pricing is traffic congestion, unlike Seattle where it is being viewed as a major way to reduce greenhouse gas reductions and fund public transit.

Planetizen Federal Action Tracker
A weekly monitor of how Trump’s orders and actions are impacting planners and planning in America.

The Simple Legislative Tool Transforming Vacant Downtowns
In California, Michigan and Georgia, an easy win is bringing dollars — and delight — back to city centers.
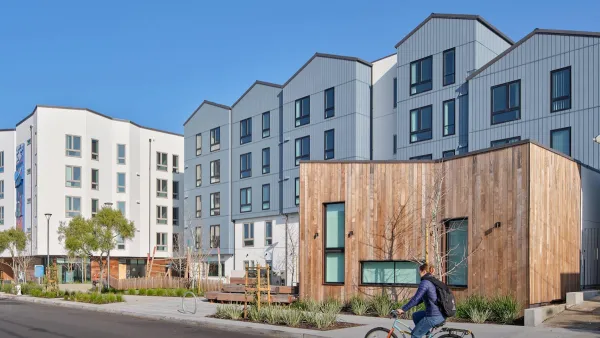
San Francisco's School District Spent $105M To Build Affordable Housing for Teachers — And That's Just the Beginning
SFUSD joins a growing list of school districts using their land holdings to address housing affordability challenges faced by their own employees.

In More Metros Than You’d Think, Suburbs are Now More Expensive Than the City
If you're moving to the burbs to save on square footage, data shows you should think again.

The States Losing Rural Delivery Rooms at an Alarming Pace
In some states, as few as 9% of rural hospitals still deliver babies. As a result, rising pre-term births, no adequate pre-term care and "harrowing" close calls are a growing reality.

The Small South Asian Republic Going all in on EVs
Thanks to one simple policy change less than five years ago, 65% of new cars in this Himalayan country are now electric.
Urban Design for Planners 1: Software Tools
This six-course series explores essential urban design concepts using open source software and equips planners with the tools they need to participate fully in the urban design process.
Planning for Universal Design
Learn the tools for implementing Universal Design in planning regulations.
Smith Gee Studio
City of Charlotte
City of Camden Redevelopment Agency
City of Astoria
Transportation Research & Education Center (TREC) at Portland State University
US High Speed Rail Association
City of Camden Redevelopment Agency
Municipality of Princeton (NJ)