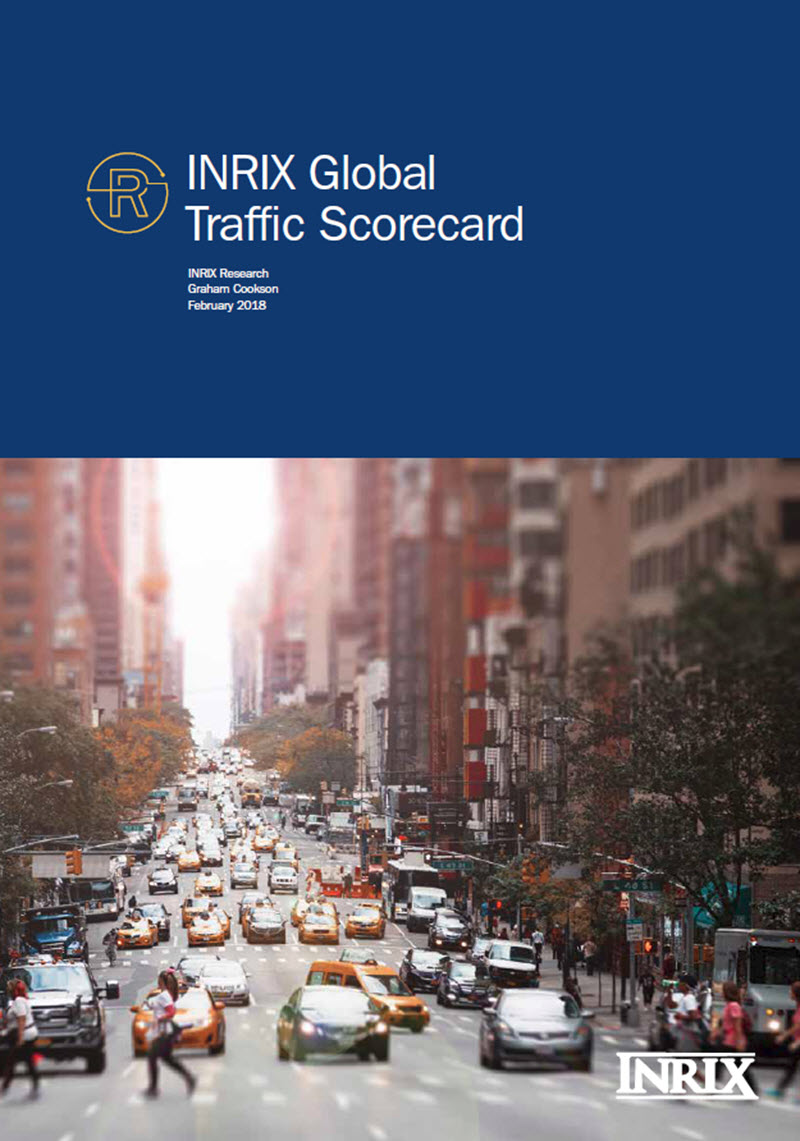
The INRIX Global Traffic Scorecard exaggerates congestion costs in order to enhance the value of its traffic monitoring services. A little skepticism is justified.

The INRIX Research corporation uses various data sets to track roadway conditions. Users receive guidance on how to avoid delays caused by congestion and accidents. As a result, they tend to exaggerate congestion costs in order to enhance the value of their services.
For example, their 2018 Global Traffic Scorecard media release claims that, "Congestion Costs Each American 97 hours, $1,348 A Year," but that is not really what their report indicates, and their dollar estimate is greatly overstated. Actual average cost of congestion is much lower than they claim.

Part of the problem is that they assume that everybody ("people") is an urban-peak automobile commuter. Their analysis indicates that an average urban-peak automobile commuter spends 97 hours or about 26 daily minutes delayed by congestion. According to Bureau of Labor Statistics data in 2018 about 115 million Americans worked full time, which represents about 35% of the total U.S. population, 20% live in non-urban areas, about 10-30% of commuters use non-auto modes (lower rates in smaller cities, higher rates in larger cities), and 10-30% of employees commute off-peak or on uncongested local streets. This suggests that only 15-25% of total Americans are urban-peak auto commuters who experience significant traffic congestion delays.
INRIX's method only measures congestion intensity, that is, the reduction in vehicle traffic speeds during peak period. It does not accurately reflect per capita congestion costs, which is the more appropriate impact to consider for planning purposes. It fails to account for commute mode share (the portion of peak-period trips made by automobile) and average automobile commute trip length, so it fails to account for the congestion avoided when commuters shift mode or live closer to their work. As a result, the report ranks transit-oriented cities such as Washington, D.C., San Francisco, New York, and Boston worse than automobile-oriented cities such as Houston, Dallas, and Atlanta, ignoring the much lower per-commuter congestion delays in the compact, multimodal cities, as illustrated below.
INRIX also greatly exaggerates the monetary value of these delays. For example, they compare peak-period traffic speeds with traffic speeds during free-flow conditions when most motorists are exceeding legal speed limits. As a result, much of their calculated congestion costs consist of motorists slowing down to legal speeds.
Although the Scorecard report does not explain their methodology, I assume that they estimate congestion costs based on average wage rates. This is a common but incorrect practice. In fact, when actually tested, for example, if they have a choice between a free but congested or tolled but free-flowing highway, only a minority of motorists are willing to pay significant amounts for travel time savings equivalent to wages; most motorists value their time at much lower rates.
The low value motorists actually place on congestion is also demonstrated at the political level. Traffic congestion can be reduced or eliminated through a combination of improving space-efficient travel options (better walking, bicycling, ridesharing and public transit services) and efficient road pricing (road tolls that increase with traffic congestion intensity). But when proposed, motorists generally oppose these solutions. When motorists reject decongestion pricing they are choosing to experience congestion, demonstrating that they would rather complain than solve the problem.
Highway advocates have long used exaggerated congestion costs to justify roadway expansions, as discussed in this blog, "2015 Urban Mobility Scorecard: Still Measuring Urban Travel Conditions Incorrectly." To their credit, the INRIX report does acknowledge that more compact, multimodal cities often have lower congestion costs per capita than sprawled cities, and they imply that public transit improvements can help reduce delays. However, this and other similar studies reflect the assumption that congestion is a cost imposed on motorists, making them innocent victims, ignoring the fact that motorists also cause the problem; when people decide to drive under urban-peak conditions they impose delays on other road users, and to the degree that rideshare vehicles and buses are delayed, it is a cost that passengers in space-intensive vehicles impose on passengers in space-efficient vehicles, which justifies decongestion pricing and bus lanes.
The truth is, traffic congestion tends to maintain equilibrium: it increases to the point that some potential peak-period vehicle trips change time, mode, route or destination. Many factors affect this point of equilibrium: improving grade-separated rail or bus rapid transit makes it easier for some travelers to shift mode: congestion does not disappear, but is less severe than would otherwise occur. Similarly, road tools and parking fees give travellers more incentive to reduce their peak-period driving. Conversely, expanded roads are soon filled with latent demands, some of those potential trips that were previously deterred by congestion. Over time, congestion returns on the expanded road and increases downstream.
For more information see the following documents:
City Observatory (2014),Questioning Congestion Costs: What’s the Real Cost of Congestion?.
Joe Cortright (2017), Driving Faster Doesn’t Make You Happier: It Just Makes You Drive Farther, City Labs.
Eric Dumbaugh (2012), Rethinking the Economics of Traffic Congestion, Atlantic Cities.
Gersh Kuntzman (2018), Congestion Pricing Would Cut Weekly Express Bus Commute Times by Hours: Report, Streets Blog.
Jonathan Levine, Joe Grengs, Qingyun Shen and Qing Shen (2012), “Does Accessibility Require Density or Speed?” Journal of the American Planning Association, Vol. 78, No. 2, pp. 157-172.
Todd Litman (2012), Smart Congestion Relief: Comprehensive Analysis Of Traffic Congestion Costs and Congestion Reduction Benefits, Victoria Transport Policy Institute.
Wes E. Marshall and Eric Dumbaugh (2018), “Revisiting the Relationship Between Traffic Congestion and the Economy: a Longitudinal Examination of U.S. Metropolitan Areas,” Transportation, pp. 1-40.
Andrew Mondschein and Brian D.Taylor (2017), “Is Traffic Congestion Overrated? Examining the Highly Variable Effects of Congestion on Travel and Accessibility,” Journal of Transport Geography, Vol. 64, pp. 65-76.

Planetizen Federal Action Tracker
A weekly monitor of how Trump’s orders and actions are impacting planners and planning in America.

Maui's Vacation Rental Debate Turns Ugly
Verbal attacks, misinformation campaigns and fistfights plague a high-stakes debate to convert thousands of vacation rentals into long-term housing.

San Francisco Suspends Traffic Calming Amidst Record Deaths
Citing “a challenging fiscal landscape,” the city will cease the program on the heels of 42 traffic deaths, including 24 pedestrians.

Amtrak Rolls Out New Orleans to Alabama “Mardi Gras” Train
The new service will operate morning and evening departures between Mobile and New Orleans.

The Subversive Car-Free Guide to Trump's Great American Road Trip
Car-free ways to access Chicagoland’s best tourist attractions.

San Antonio and Austin are Fusing Into one Massive Megaregion
The region spanning the two central Texas cities is growing fast, posing challenges for local infrastructure and water supplies.
Urban Design for Planners 1: Software Tools
This six-course series explores essential urban design concepts using open source software and equips planners with the tools they need to participate fully in the urban design process.
Planning for Universal Design
Learn the tools for implementing Universal Design in planning regulations.
Heyer Gruel & Associates PA
JM Goldson LLC
Custer County Colorado
City of Camden Redevelopment Agency
City of Astoria
Transportation Research & Education Center (TREC) at Portland State University
Jefferson Parish Government
Camden Redevelopment Agency
City of Claremont


