The new Urban Mobility Scorecard measures traffic congestion with greater precision, but incorrectly. As with previous editions, it exaggerates congestion costs and undervalues the congestion reduction benefits of alternative modes and Smart Growth.

Today the Texas Transportation Institute released the 2015 Urban Mobility Scorecard, an annual report that measures the intensity of traffic congestion in 370 U.S. cities. As with previous editions, it claims that cities suffer "gridlock" which causes "traveller misery," and the problem will become much more serve in the future unless cities apply an "'all-hands-on-deck' approach." Hold the hyperbole, please!
As in previous editions, the report is structured to exaggerate congestion problems and understate the potential benefits of alternative modes and smart growth policies, as described in my previous blog, "Critiquing the Urban Mobility Report."
TTI's method only measures congestion intensity, that is, the reduction in vehicle traffic speeds during peak period, rather than per capita congestion costs, which is the more appropriate impact to consider for planning purposes. It fails to account for commute mode share (the portion of peak-period trips made by automobile) and average automobile commute trip length, so it fails to account for the congestion avoided when commuters shift mode or live closer to their work. As a result, the report ranks transit-oriented cities such as Washington, D.C., San Francisco, New York, and Boston worse than automobile-oriented cities such as Houston, Dallas, and Atlanta, ignoring the much lower per-commuter congestion delays in the compact, multimodal cities, as illustrated below.

The Urban Mobility Report’s title is inaccurate: it should be renamed the Traffic Congestion Report, because it ignores other modes and other urban transport performance factors such as affordability, safety, and local economic development.
The Scorecard uses freeflow traffic speeds as a baseline (the speed below which congestion delays are calculated), although freeflow speeds often significantly exceed legal speed limits. For example, if freeflow speeds average 70 mph, and congestion reduces peak-period traffic speeds to 50 mph, the UMR considers the entire 20 mph speed reduction a cost, even on roads with 60 mph speed limits. By my estimate, a third or more of the report's estimated congestion "costs" reflect traffic speed compliance (motorists reducing speeds to legal limits). In fact, freeflow speeds are not optimal: 45-55 mph traffic speeds tend to maximize roadway capacity and vehicle fuel efficiency. As a result, many transport economists recommend using lower baseline speeds.
The report is biased in various ways:
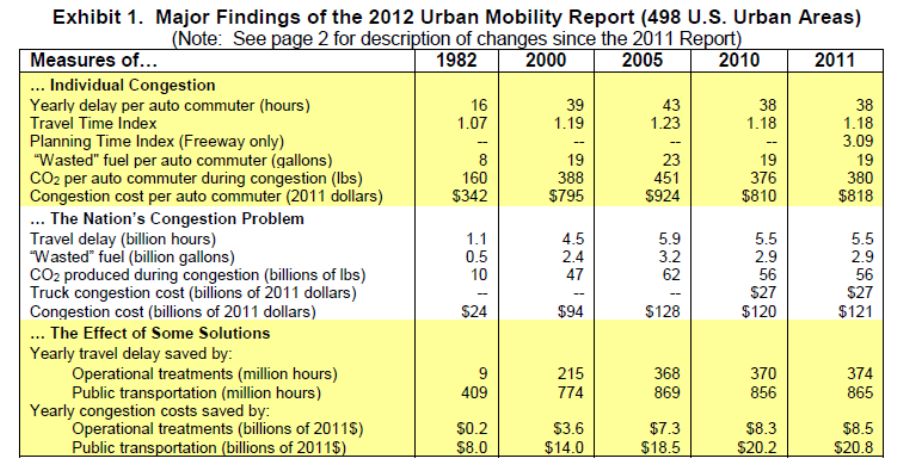
- A striking indication of bias is that it compares 2014 congestion with 1982, 2000, 2010, and 2013, but conveniently omits 2005, the year in which congestion costs per automobile commuter actually peaked, as indicated in table below, from the 2012 Urban Mobility Report.

- It reports very large numbers (such as 6.9 billion hours extra travel time and 3.1 billion gallons of extra fuel consumed) but fails to put this into perspective. Is this really "massive"? In 2014, the United States used about 137 billion gallons of gasoline, so this represents a 2 percent increase. Other factors, such as sprawl and chauffeuring burdens cause much greater increases in the time and fuel people must spend driving. Even waiting for coffee can impose more delay than congestion. Why does TTI ignore these factors that lead to even larger total increases in travel time and fuel consumption?
- The report continues to use the terms "person" and "commuter" when it really means "peak-period automobile commuter." As a result, it ignores the congestion avoided when people shift modes, and therefore the full congestion reduction value of strategies such as dedicated bus lanes.
- To predict future congestion problems, the report uses a model based on traffic growth rates between 2000 and 2005, before VMT peaked, which ignores Baby Boomer aging and changing Millennial travel preferences, and so is biased upward.
- Once again, the report uses exaggerated values of travel time. It uses $17.67 for personal travel, based on their own 1986 study, although the U.S. DOT recommends that personal travel time be valued at 50 percent of wage rates, with a default wage rate of $23.90 in 2009 dollars, or $26.59 in 2015 dollars, and so should be valued at $13.30.
- The discussion of congestion relief strategies fails to recognize that, due to induced vehicle travel, roadway expansions contradict other planning objectives (for example, by increasing total vehicle traffic, roadway expansion tends to increase parking problems, total accidents and pollution emissions) and only provide short-term congestion reductions. Yet improving alternative modes (particularly grade-separated transit) and providing incentives such as efficient parking and road pricing help achieve other planning objectives, such as consumer savings, reduced parking congestion, increased traffic safety, improved mobility for non-drivers, and improved public fitness and health.
- New technologies can significantly reduce congestion costs. For example, people who are concerned about on-time arrival (e.g., commercial drivers and people making critical trips) can obtain real-time traffic information to better plan their trips or use their mobile phones to warn others of delays (for example, for a meeting). Also, many activities that previously required physical meetings can now be done electronically. Rather than celebrating these innovations, the report assumes that new technologies do nothing to reduce congestion costs.
- The report lacks the basic features of a quality academic study: there is no discussion of assumptions and alternative analysis methods, sensitivity analysis, discussion of uncertainties and biases, references, or peer review. It fails to cite any of the current literature on congestion evaluation methods, or respond to critiques of previous editions by myself and others.
For More Information
Md Aftabuzzaman, Graham Currie and Majid Sarvi (2011), “Exploring The Underlying Dimensions Of Elements Affecting Traffic Congestion Relief Impact Of Transit,” Cities, Vol. 28, Is. 1, February, Pages 36-44.
Michael L. Anderson (2013), Subways, Strikes, and Slowdowns: The Impacts of Public Transit on Traffic Congestion, Working Paper No. 18757, National Bureau of Economic Research.
Matthew Barth and Kanok Boriboonsomin (2009), “Traffic Congestion And Greenhouse Gases,” Access 35, University of California Transportation Center (www.uctc.net), pp. 2-9.
Questioning Congestion Costs: What’s the Real Cost of Congestion?, and Boo! The Annual Carmaggedon Scare is Upon Us, City Observatory.
Eric Dumbaugh (2012), Rethinking the Economics of Traffic Congestion, Atlantic Cities, 1 June 2012.
Todd Litman (2013), “Smarter Congestion Relief In Asian Cities: Win-Win Solutions To Urban Transport Problems,” Transport and Communications Bulletin for Asia and the Pacific, United Nation’s Economic and Social Commission for Asia and the Pacific, No. 82, pp. 1-18.
Todd Litman (2014), Congestion Costing Critique: Critical Evaluation of the ‘Urban Mobility Report,’ Victoria Transport Policy Institute.
Todd Litman (2014), Congestion Evaluation Best Practices, Paper 12, International Transportation Economic Development Conference, 2014, Dallas, Texas.
Todd Litman (2014), Reform Transport Engineering: Expand Beyond Just Roadway Level of Service (LOS) Ratings, Planetizen.
Todd Litman (2014), Is Traffic Speed Compliance A Congestion Cost?, Planetizen.
Tanya Snyder (2012), There’s a Lot Riding on U.S. DOT’s Definition of 'Congestion', Planetizen.
Ian Wallis and David Lupton (2013), The Costs Of Congestion Reappraised, Report 489, New Zealand Transport Agency.

Planetizen Federal Action Tracker
A weekly monitor of how Trump’s orders and actions are impacting planners and planning in America.

Chicago’s Ghost Rails
Just beneath the surface of the modern city lie the remnants of its expansive early 20th-century streetcar system.

San Antonio and Austin are Fusing Into one Massive Megaregion
The region spanning the two central Texas cities is growing fast, posing challenges for local infrastructure and water supplies.

Since Zion's Shuttles Went Electric “The Smog is Gone”
Visitors to Zion National Park can enjoy the canyon via the nation’s first fully electric park shuttle system.

Trump Distributing DOT Safety Funds at 1/10 Rate of Biden
Funds for Safe Streets and other transportation safety and equity programs are being held up by administrative reviews and conflicts with the Trump administration’s priorities.

German Cities Subsidize Taxis for Women Amid Wave of Violence
Free or low-cost taxi rides can help women navigate cities more safely, but critics say the programs don't address the root causes of violence against women.
Urban Design for Planners 1: Software Tools
This six-course series explores essential urban design concepts using open source software and equips planners with the tools they need to participate fully in the urban design process.
Planning for Universal Design
Learn the tools for implementing Universal Design in planning regulations.
planning NEXT
Appalachian Highlands Housing Partners
Mpact (founded as Rail~Volution)
City of Camden Redevelopment Agency
City of Astoria
City of Portland
City of Laramie


