


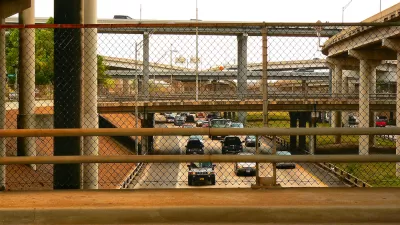
The "Urban Mobility Report" produces widely-cited congestion cost estimates. It is biased in various ways that exaggerate congestion costs and roadway expansion benefits. Few users of these cost estimates seem aware of these problems.

One of a planner’s main jobs is to produce objective technical analysis. We assemble and organize data so the facts can speak for themselves. However, behind most technical reports is a dramatic story.
For example, the Urban Mobility Report (UMR) calculates traffic congestion costs for U.S. cities. Behind the numbers is the following narrative: Automobile commuters are good, hard-working people victimized by villainous traffic congestion, which threatens our productivity and happiness. Traffic engineers are heroes who can defeat this monster if given sufficient resources. Success requires that wise but distant decision-makers (city councilors, transportation agencies, governors, congress, etc.) be persuaded of the problem's severity so congestion reduction campaigns can receive the support they deserve, leading once again to economic growth and happiness.
What’s wrong with this narrative? A lot if you care about transport system efficiency and equity. It assumes that “transportation” means automobile travel, ignoring other modes. It assumes that congestion is the most important transport planning issue, ignoring other objectives and impacts. It ignores other factors that affect mobility and accessibility, and the indirect costs of highway expansion. It ignores motorists’ complicity in creating congestion when they choose automobile-dependent lifestyles, and as citizens when they oppose efforts to improve alternative mode and transport pricing reforms. This narrative directs resources to roadway expansion over more efficient and equitable solutions.
The Urban Mobility Report is biased in various ways that exaggerate congestion costs and roadway expansion benefits. It ignores basic research principles: it provides no literature review, it fails to explain key assumptions, it inadequately cites sources, and incorporates no external peer review. It ignores recent research concerning factors that affect traffic congestion. Yet, few practitioners, decision-makers or journalists who use UMR results seem aware of these problems.
My new report Congestion Costing Critique: Critical Evaluation of the “Urban Mobility Report” investigates these issues. This blog describes my key findings. For more detailed information please read the full report.
Defining Congestion
The Urban Mobility Report’s title is inaccurate: it should be renamed the Traffic Congestion Report since it ignores other modes and urban transport performance factors. The UMR uses the terms commuter when the analysis only considers automobile commuters. This significantly skews results. For example, the UMR indicates that in 2011 Washington DC’s automobile commuters experienced 67 average annual hours of delay, but since that region has only 43% auto commute mode share this averages just 29 hours per commuter. In contrast, Houston’s automobile commuters experience a somewhat lower 52 annual hours of delay, but since it has a 88% auto mode share this averages 46 hours per commuter overall, much higher than Washington DC. This shows how alternative modes can help reduce total congestion costs. Yet, the UMR only values walking, cycling and public transit to the degree they reduce vehicle congestion; it assigns no benefit to the congestion avoided by the travelers who shift mode.
Congestion Costing Methods
Although not mentioned in the Urban Mobility Report, there is considerable debate among transport economists concerning how best to measure congestion costs. One key issue is the baseline (or threshold) speed below which congestion delays are calculated. Lower baselines result in lower congestion cost values. The UMR uses freeflow speeds (level-of-service A) as a baseline. For example, if a roadway’s legal speed limit is 60 mph, and congestion reduces peak-period traffic speeds to 50 mph, the UMR considers the 10 mph speed reduction wasted time. However, freeflow speeds are not optimal: 45-55 mph traffic speeds tend to maximize roadway capacity and vehicle fuel efficiency. As a result, many transport economists recommend using lower baseline speeds.
Another key factor is the dollar value assigned to delay. The U.S. Department of Transportation recommends valuing personal travel at 35% to 60% of prevailing incomes, or $8.37 to $14.34 per hour, based on $23.90 overall national average incomes. The UMR uses $16.79 per hour (although it cites $8 per hour on page 24 and $16 on pages 25-31), 40% more than the USDOT’s $12 per hour default value.
The Urban Mobility Report's congestion cost estimates therefore represent upper-bound values while more reasonable assumptions would result in much lower congestion cost estimates. The following graph compares the UMR's $121 billion upper-bound cost estimate based on a freeflow speed baseline and $16.79 per hour time costs with a middle-range value based on 70% baseline and $12 per hour value, and a lower-range value based on a 50% baseline and $8.37 per hour.
Congestion Cost Ranges

The Urban Mobility Report uses an upper-bound travel speed baseline and travel time unit costs. Most economists recommend lower values. The lower-bound estimate is based on Transport Canada’s lower baseline speed and the U.S. Department of Transportation’s lower travel time unit costs. The UMR does not explain how it selected its assumptions or discuss possible analysis biases, which violates basic research principles.
Comparing Costs
The Urban Mobility Report claims that traffic congestion wastes “massive” amounts of time and money, estimated at 5.5 billion hours and 2.9 billion gallons of fuel, worth an estimated $121 billion. Described this way the costs do seem large, but measured per capita they seem modest: 17 hours, 9 gallons and $388 per year, or less than three minutes, 0.03 gallons and $1.06 per day. These represent less than 2% of total travel time and fuel costs.
The following graph compares various transportation costs, measured annually per capita. Congestion costs are estimated to range from $110 (50% baseline speeds and $8.37 per hour time costs) up to $388 (the UMR’s estimate) compared with approximately $2,600 in vehicle ownership costs, $1,500 in crash damages, $1,200 in parking costs, $500 in pollution damage costs and $325 in roadway costs.
Costs Ranked by Magnitude

Congestion costs are estimated to range between about $110 and $340 annual per capita, depending on assumptions. These are modest compared with other transportation costs.
Because congestion costs are overall modest, it is inappropriate to evaluate potential congestion reduction strategies in isolation: a strategy may provide little net benefit if it increases other costs, but is worth far more if it reduces other costs or provides other benefits. For example, roadway expansions may seem cost effective considering just congestion reduction benefits, but if they induce additional vehicle travel which increases other traffic problems, the overall economic impacts may be negative. On the other hand, improving walking, cycling and public transit, or efficient parking pricing may seem to provide only modest congestion reduction benefits, but turn out to be very cost effective considering their co-benefits.
The Urban Mobility Report incorporates a striking example of bias hidden in its technical analysis: it assumes that any traffic speed increase reduces per-mile fuel consumption and emission rates, although most other studies find that these rates minimize at 45-55 miles per hour and increase with higher speeds, as illustrated below. As a result, the UMR assumes that reducing congestion always saves energy and reduces emissions although other researchers conclude otherwise. For example, Barth and Boriboonsomin explain, “If moderate congestion brings average speeds down from a free-flow speed over 70 mph to a slower speed of 45 to 55 mph, this moderate congestion can reduce CO2 emissions. If congestion mitigation raises average traffic speed to above about 65 miles per hour, it can increase emissions. And, of course, speeds above 65 or 70 also make the roadway more dangerous.”
Emission Curves Compared

The Urban Mobility Report ignores this last point, that congestion reductions can increase traffic risks, although it is much discussed by traffic safety researchers. Crash rates tend to be lowest on moderately congested roads (V/C=0.6), and increase at lower and higher congestion levels, while fatalities decline at high levels of congestion, indicating a tradeoff between congestion and safety. Per capita traffic deaths tend to increase with per capita vehicle travel, so if roadway expansions induce additional vehicle travel this tends to increase traffic casualties.
Exaggerating Future Congestion Problems
The Urban Mobility Report’s press release headline, “As traffic jams worsen, commuters allow extra time for urgent trips…” implies that congestion problems are increasing, but the analysis actually indicates that congestion has decreased in recent years due to demographic and economic trends that have caused vehicle travel to peak in North America. Yet, the UMB simply extrapolates the high pre-2006 traffic growth rates without accounting for underlying demographic and economic factors that affect travel demands. In other words, the UMR assumes that the future will simply be a repeat of the past, ignoring fundamental changes in travel demands.
Conclusions and Recommendations
The Urban Mobility Report has significant omissions and biases.
- It fails to review current congestion costing literature, discuss the advantages and disadvantages of different methods, and explain why the selected methodology and assumptions were chosen.
- It uses methods and assumptions that result in upper-bound congestion cost estimates, including freeflow travel speed baseline, although many experts recommend lower values, and $16.79 per hour travel time values, far higher than recommended by the USDOT.
- It fails to consider factors that significantly affect accessibility and transport costs, including the quality of transport options, roadway connectivity, and land use proximity, and ways that various congestion reduction strategies can affect these factors.
- It exaggerates congestion compared with other transportation costs. It calls congestion costs “massive,” although they are relatively modest overall, at most increasing travel time and fuel consumption by 2%.
- It ignores generated traffic and induced travel impacts, which reduce congestion reduction benefits and increase indirect and external costs, reducing roadway expansion net benefits.
- It predicts that traffic congestion problems will increase significantly in the future, based on the assumption that traffic will grow as rapidly in the future as during the peak growth years of the late twentieth century. This ignores widely-recognized demographic and economic trends which are changing travel demands. In fact, most experts predict that congestion problems are unlikely to increase significantly in the future, and can be reduced effectively by meeting growing demands for alternative travel options and using TDM strategies.
- It ignores positive trends, including recent declines in total congestion, changing travel demands which are causing vehicle travel to peak and improving the effectiveness of transportation demand management strategies, plus improved technologies and travel options that allow travelers to avoid congestion.
The Urban Mobility Report’s estimates represent the upper-bound range of possible congestion costs; applying methodologies and assumptions generally recommended by economists and government agencies can reduce these estimates by half or two-thirds. To be comprehensive and objective, the UMR should summarize current congestion costing research; discuss different evaluation perspectives and costing methods; explain why the methods and assumptions it uses were selected; apply sensitivity analysis; compare congestion with other transport costs; account for changing travel demands; consider all impacts when evaluating potential congestion reduction strategies, and provide more transparency, quality control and peer review.
This is not to deny that traffic congestion is a problem: it is frustrating, increases costs and reduces productivity. However, it is essential to properly define this problem and evaluate potential solutions. If you ask, "Is congestion a problem, and is congestion reduction an important planning objectives?" most would surely agree. If you ask, "How does congestion compare with other transport problems?" surveys rank it in the middle. If you ask, "Would you prefer roadway expansion or other, equally cost effective congestion reduction strategies?" the results are usually mixed. However, if you asked, "Would you prefer roadway expansion or other strategies that provide comparable congestion reductions plus other significant benefits?" most people would probably choose the later.
Unfortunately, the Urban Mobility Report fails to ask these important questions. It argues that traffic congestion is a severe and growing problem with no consideration to context, such as the role of mobility in overall accessibility, the tendency of congestion to maintain equilibrium, other planning objectives, and external costs of roadway expansion and the additional traffic it induces. This reductionist, engineering perspective is inappropriate in urban areas where context is important. An economic or planning perspective supports more comprehensive and integrated decision-making; it allows communities to identify "win-win" solutions: the congestion reduction strategies that help achieve other planning objectives and therefore maximize benefits overall.
For More Information
Robert L. Bertini (2005), You Are the Traffic Jam: An Examination of Congestion Measures, TRB Annual Meeting.
Joe Cortright (2010), Driven Apart: How Sprawl is Lengthening Our Commutes and Why Misleading Mobility Measures are Making Things Worse, CEOs for Cities (www.ceosforcities.org).
Eric Dumbaugh (2012), Rethinking the Economics of Traffic Congestion, Atlantic Cities, 1 June 2012.
Susan Grant-Muller and James Laird (2007), International Literature Review of the Costs of Road Traffic Congestion, Scottish Executive (www.scotland.gov.uk).
Zachary Howard and Clark Williams-Derry (2012), How Much Do Drivers Pay For A Quicker Commute? New Evidence Suggests That It's Less Than We Think, Sightline Institute (www.sightline.org).
Todd Litman (2009), “Congestion Costs,” Transportation Cost and Benefit Analysis; Techniques, Estimates and Implications, Victoria Transport Policy Institute (www.vtpi.org/tca).
Todd Litman (2012), Smart Congestion Relief: Comprehensive Analysis Of Traffic Congestion Costs and Congestion Reduction Benefits, paper P12-5310, Transportation Research Board Annual Meeting (www.trb.org).
Todd Litman (2012), Toward More Comprehensive Understanding of Traffic Congestion, Planetizen Blog.
Todd Litman (2012), Measuring Transport System Efficiency, Planetizen Blog.
TC (2006), The Cost Of Urban Congestion In Canada, Transport Canada (www.tc.gc.ca)
TTI (2012), Urban Mobility Report, Texas Transportation Institute.

Smart Congestion Costing: A Critical Evaluation of the 'Urban Mobility Report'
The new "Urban Mobility Report" provides widely-cited congestion cost estimates. However, its analysis is neither comprehensive nor objective. Anybody using these estimates should understand its omissions and biases.
Same Source Data, 'Contradictory Conclusions' on Congestion
A curious discrepancy between two major congestion reports using the same data: There is a profound and unexplained discrepancy between the travel trends in the latest Urban Mobility Scorecard report and the data provided by Inrix.
Congestion Costing Point-Counter-Point
Conventional transportation planning tends to exaggerate congestion costs and roadway expansion benefits, and undervalues other transportation solutions such as improving alternative modes, pricing reforms and smart growth policies.

Planetizen Federal Action Tracker
A weekly monitor of how Trump’s orders and actions are impacting planners and planning in America.
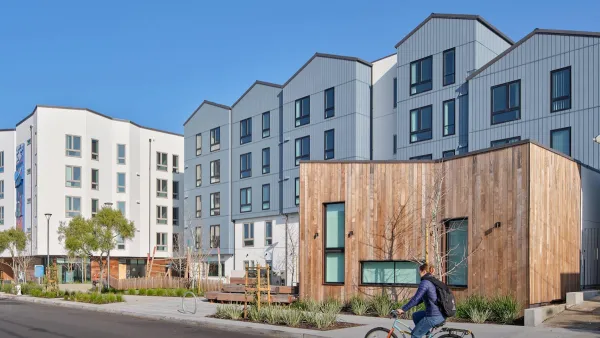
San Francisco's School District Spent $105M To Build Affordable Housing for Teachers — And That's Just the Beginning
SFUSD joins a growing list of school districts using their land holdings to address housing affordability challenges faced by their own employees.
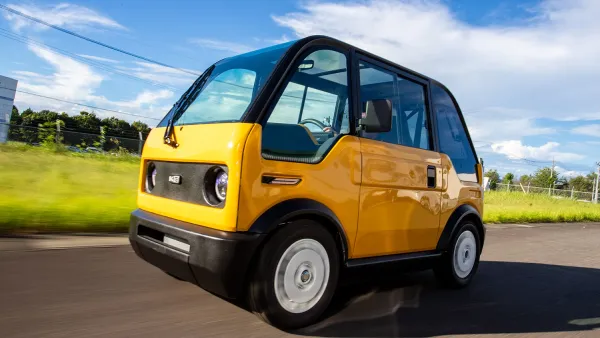
The Tiny, Adorable $7,000 Car Turning Japan Onto EVs
The single seat Mibot charges from a regular plug as quickly as an iPad, and is about half the price of an average EV.

As Trump Phases Out FEMA, Is It Time to Flee the Floodplains?
With less federal funding available for disaster relief efforts, the need to relocate at-risk communities is more urgent than ever.

With Protected Lanes, 460% More People Commute by Bike
For those needing more ammo, more data proving what we already knew is here.

In More Metros Than You’d Think, Suburbs are Now More Expensive Than the City
If you're moving to the burbs to save on square footage, data shows you should think again.
Urban Design for Planners 1: Software Tools
This six-course series explores essential urban design concepts using open source software and equips planners with the tools they need to participate fully in the urban design process.
Planning for Universal Design
Learn the tools for implementing Universal Design in planning regulations.
Smith Gee Studio
City of Charlotte
City of Camden Redevelopment Agency
City of Astoria
Transportation Research & Education Center (TREC) at Portland State University
US High Speed Rail Association
City of Camden Redevelopment Agency
Municipality of Princeton (NJ)