


In the election's wake, Richard Florida compiles some telling statistics on the nation's threatened middle class. It's on the decline, yes, but it's also becoming more segregated into certain cities, often in the Sunbelt and Rust Belt.
We've all seen the statistics on America's shrinking middle class. But how is that decline dispersed geographically, especially in metro areas? Richard Florida discusses data from Pew covering 2000 through 2014.
For one thing, a process of segregation is taking place, dividing metros and neighborhoods more thoroughly by income. "Nationwide, 172 of 229 metros saw growth in affluent, upper-income households in the past decade and a half; 160 saw an increase in the share of low-income households; and roughly half, 108, experienced both." Also, "[t]he share of American families living in either all-poor or all-affluent neighborhoods more than doubled, increasing from roughly 15 percent to nearly 34 percent."
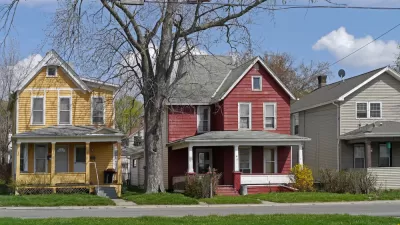
Florida points out that across the country, cities are seeing their middle classes shrink. "What really stands out is that every single large metro (over one million people) saw its middle class decline. In fact, less than 10 percent of all U.S. metros saw any increase in their middle class whatsoever, with most of these gains being in the range of one percent. The large metros where the middle class is smallest are a combination of superstar cities, tech hubs, resource economies and poorer places. [Among large metros] L.A. has the smallest middle class overall, followed by San Francisco, New York, and San Jose."
From the maps included, it's clear that the metros with the largest middle classes tend to be in places that favored Donald Trump this year. "Simply put, a big part of our national economic dilemma is this: the middle class is larger in declining places and smaller in growing ones. This is especially troubling as a large middle class remains a bulwark against rising economic inequality."
FULL STORY: The Geography of Middle Class Decline

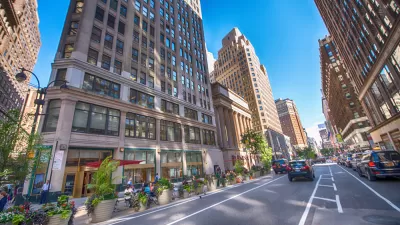
Richard Florida: Urban Land Values Reflect Spatial Inequality
Overall, the value of American land is strikingly high. But it's the differences between and within cities that concern Florida.
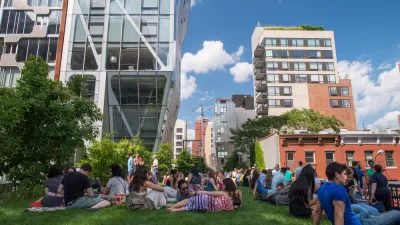
'The New Urban Crisis' and the High Line
A PBS NewsHour two-fer: an interview of urbanologist Richard Florida conducted in a walking tour of New York's famed High Line in the gentrifying West Chelsea neighborhood, a fitting backdrop for his new book, "The New Urban Crisis."

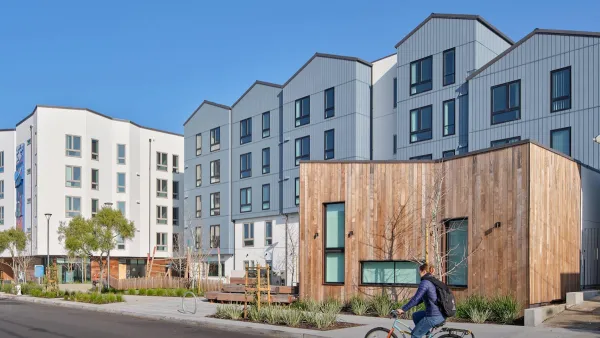
What's so Miraculous about Minneapolis?
Minneapolis combines prosperity with plentiful affordable housing, an increasing rarity. Geographical factors play a role, but longstanding "fiscal equalization" policies may make the difference.

Planetizen Federal Action Tracker
A weekly monitor of how Trump’s orders and actions are impacting planners and planning in America.

The Simple Legislative Tool Transforming Vacant Downtowns
In California, Michigan and Georgia, an easy win is bringing dollars — and delight — back to city centers.
San Francisco's School District Spent $105M To Build Affordable Housing for Teachers — And That's Just the Beginning
SFUSD joins a growing list of school districts using their land holdings to address housing affordability challenges faced by their own employees.

In More Metros Than You’d Think, Suburbs are Now More Expensive Than the City
If you're moving to the burbs to save on square footage, data shows you should think again.

The States Losing Rural Delivery Rooms at an Alarming Pace
In some states, as few as 9% of rural hospitals still deliver babies. As a result, rising pre-term births, no adequate pre-term care and "harrowing" close calls are a growing reality.

The Small South Asian Republic Going all in on EVs
Thanks to one simple policy change less than five years ago, 65% of new cars in this Himalayan country are now electric.
Urban Design for Planners 1: Software Tools
This six-course series explores essential urban design concepts using open source software and equips planners with the tools they need to participate fully in the urban design process.
Planning for Universal Design
Learn the tools for implementing Universal Design in planning regulations.
Smith Gee Studio
City of Charlotte
City of Camden Redevelopment Agency
City of Astoria
Transportation Research & Education Center (TREC) at Portland State University
US High Speed Rail Association
City of Camden Redevelopment Agency
Municipality of Princeton (NJ)