statistics

How Data-Driven Research Is Shaping Sustainable Urban Development
Explore how data-driven research is revolutionizing sustainable urban development, creating smarter, greener, and more resilient cities for the future.

10 Stats That Explain the World in 2017
Looking for lessons about 2017?

Trump Administration's Draft Budget Raises New Concerns About Data Collection
President Trump has made no secret of his disdain for many of the traditional data points used to represent the health and prosperity of the country. The budgetary process offers an opportunity to match words with action.

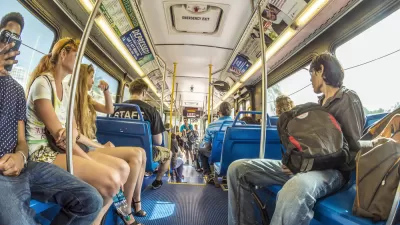
Research: Bus Riders Safer Than Car Drivers
Taking the bus might not feel as comfortable as going by car, but according to this research from Montreal, it's safer.

An Uncertain Future: America's Urban Middle Class
In the election's wake, Richard Florida compiles some telling statistics on the nation's threatened middle class. It's on the decline, yes, but it's also becoming more segregated into certain cities, often in the Sunbelt and Rust Belt.

Where Will Gentrification Happen Next?
This map tool hows gentrification-related statistics by Bay Area neighborhood, helping communities guess where the heaviest gentrification will occur.

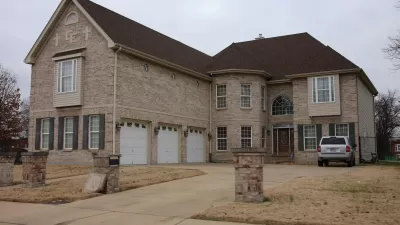
Why the McMansion Isn't Really Back
Joe Cortright criticizes reports linking high median new home sizes to a renewed demand for McMansions. The market for single-family homes, he argues, locks out buyers of modest means. Only the well-off are buying.

Most Downtowns Still Lagging Behind
Central districts have been surging back since the 1980s. But in most cities, the upper third of earners still favor outlying areas and are underrepresented closer to downtown.
See-Saws, Circles, and Narrative Fallacies
A minor word of caution on statistical inference and the stories it can tell
Extreme Wealth and Poverty Grow in Brooklyn
A quick look at some of Brooklyn's demographic data illustrates a dramatic divide between the Borough's most wealthy and most poor - economic segregation at its extreme in America.
Is Any City Truly Unique?
As new research data on cities pours in daily, interesting patterns emerge regarding income, green space and urban growth. Like people in their genetic make-up, are cities fundamentally all the same?
Choosing Ignorance is Stupid
People love statistics. They let us understanding the world beyond our own senses. USA Today publishes a daily Snapshot which presents a graph of random statistics. Sports talk and business analysis are dominated by statistics. We measure our progress, or lack thereof, and compare ourselves with others, based on statistics about our size, activities and accomplishments.
What's the Big Deal With 'Big Data'?
Ben Hecht contemplates the currency of the digital age and how it will transform the cities we live in.
In Manhattan, Shopping and Driving Don't Mix
The New York City Department of Transportation's yearly statistical smorgasbord adds a new tool: neighborhood travel profiles showing how people arrived in eight neighborhoods. In many of them, the number of drivers was in the single digits.
Forget Cities - It's Regions and Neighborhoods That Matter
When it comes to economics, statistics, demographics, development, and our daily actions, city lines don't count for much - neighborhoods and regions are where things happen, says Kaid Benfield.
Why the Census Needs Adjustment
The Census is going to be wrong, according to this column from The Washington Post. Statistical adjustments help get undercounts closer to reality, but many opponents prevent their use.
Stats Systems to See Upgrade in Federal Budget
This post from The New Republic explains how the federal budget includes plans to upgrade some of the varied parts that track statistics in the country.
Fun with transportation statistics
A few days ago, I was looking at a regional planning document and saw something startling: an assertion that transit ridership in my region has been going down. Since transit ridership has been going up nationwide, I smelled a rat. After digging around through a big pile of statistics, I realized that there are so many different ways of measuring transit ridership that one can easily prove either that ridership is going up or that ridership is going down. Some possible measurements include:
Urban Design for Planners 1: Software Tools
This six-course series explores essential urban design concepts using open source software and equips planners with the tools they need to participate fully in the urban design process.
Planning for Universal Design
Learn the tools for implementing Universal Design in planning regulations.
Heyer Gruel & Associates PA
JM Goldson LLC
Custer County Colorado
City of Camden Redevelopment Agency
City of Astoria
Transportation Research & Education Center (TREC) at Portland State University
Jefferson Parish Government
Camden Redevelopment Agency
City of Claremont


