


"Not knowing which kinds of buildings consume what is like not being able to gauge differences between a diesel truck and a hybrid car."
Laura Bliss reports on a new tool produced by Stephanie Pincetl, a UCLA environmental planning scholar, and her colleagues at the California Center for Sustainable Communities to measure the energy use of buildings around Los Angeles County.
The Energy Atlas, as it's known, provides a database that "charts and maps previously unreleased data on household natural gas and electricity consumption obtained from utilities alongside Census records." Bliss also adds that the Energy Atlas is "fully searchable: The curious can sort L.A.’s energy use by income, neighborhood, energy type, building age, and plenty of other measures."
Bliss then puts the Energy Atlas to good use, exploring its database for a few conclusions about energy use in Los Angeles. So, for instance, Bliss uncovers this probably-not-at-all surprising revelation: "Given that low-income families tend to live in multi-family buildings, perhaps it’s not surprising that the highest energy users were also those with the highest incomes. Residents of wealthy beachside Malibu used more than 10 times more energy per capita than those in working-class Bell, a city south of east L.A."
FULL STORY: L.A.'s New 'Energy Atlas' Maps Who Sucks the Most Off the Grid


New Alaska Bitcoin Mine Would Burn as Much Energy as the State’s Largest Coal Plant
Fueled by “stranded” natural gas, the startup hopes to become the largest in the US, and to make Alaska an industry center.
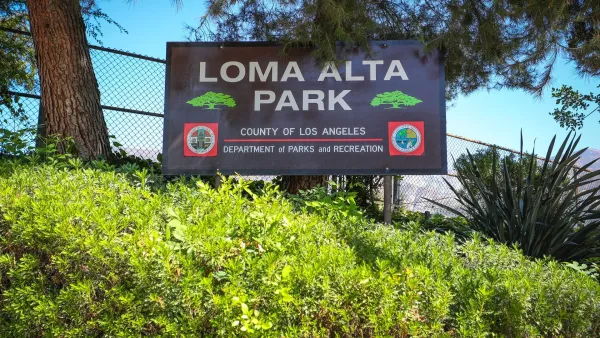
A Park Reborn: Resilience and Renewal in Fire-Stricken Altadena
Rebuilt in just two months after the devastating Eaton Fire, Loma Alta Park now stands as a symbol of community resilience and renewal, even as some residents hope recovery efforts will continue to support housing stability and long-term equity.

Rethinking Computing: Researchers Tackle AI’s Energy Demands
USC researchers are reimagining how AI systems are trained and powered — through smarter algorithms, innovative hardware, and brain-inspired designs — to dramatically reduce computing’s energy footprint.

Planetizen Federal Action Tracker
A weekly monitor of how Trump’s orders and actions are impacting planners and planning in America.

Maui's Vacation Rental Debate Turns Ugly
Verbal attacks, misinformation campaigns and fistfights plague a high-stakes debate to convert thousands of vacation rentals into long-term housing.

San Francisco Suspends Traffic Calming Amidst Record Deaths
Citing “a challenging fiscal landscape,” the city will cease the program on the heels of 42 traffic deaths, including 24 pedestrians.

Amtrak Rolls Out New Orleans to Alabama “Mardi Gras” Train
The new service will operate morning and evening departures between Mobile and New Orleans.

The Subversive Car-Free Guide to Trump's Great American Road Trip
Car-free ways to access Chicagoland’s best tourist attractions.

San Antonio and Austin are Fusing Into one Massive Megaregion
The region spanning the two central Texas cities is growing fast, posing challenges for local infrastructure and water supplies.
Urban Design for Planners 1: Software Tools
This six-course series explores essential urban design concepts using open source software and equips planners with the tools they need to participate fully in the urban design process.
Planning for Universal Design
Learn the tools for implementing Universal Design in planning regulations.
Heyer Gruel & Associates PA
JM Goldson LLC
Custer County Colorado
City of Camden Redevelopment Agency
City of Astoria
Transportation Research & Education Center (TREC) at Portland State University
Jefferson Parish Government
Camden Redevelopment Agency
City of Claremont