


Ben Wellington teaches a statistics course based on NYC Open Data at the Pratt Institute’s City & Regional Planning program, and is the founder of the quirky data blog "I Quant NY."
In a recent interview with Noah Davis on Pacific Standard, Ben Wellington discusses his blog, I Quant NY, which stemmed from his Pratt Institute course on NYC Open Data. Posting his discoveries on the website, which can range from the farthest Brooklyn apartment to a subway stop to the fire hydrant that brought in the most ticket revenue for the city, Wellington's findings have not only received substantial media attention but have also influenced policy.
In the interview, Wellington shares how his discoveries are led by asking the right questions, and do not involve complex algorithms or high-level statistical knowledge. He says, "If you look through Freakanomics, they aren’t doing the fanciest analysis. They are looking at one variable, but they are looking at it from a new angle. For the most part, all my work is just counts and means. The fanciest thing is a correlation."
As a utilizer of open data, Wellington believes that this new powerful tool "plays two roles. You’re leveraging the power of people who are passionate to find things... On the other hand, it’s also a bit of a watchdog with transparency and accountability."
FULL STORY: The Man Who’s Quantifying New York City


New Interactive Mapping Tool Tracks all of NYC's Infrastructure Projects, Housing Permits, and City Facilities
The New York Department of City Planning has taken its open data practices to a new level with the launch of the Capital Planning Explorer.
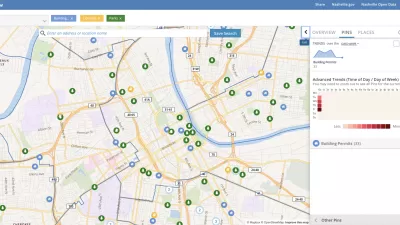
Presenting Municipal Data in an Interactive Map, Nashville Style
The city of Nashville launched the NashView interactive data map earlier this month.

DataUSA: An Intuitive Tool for Public Data
A collaboration between Deloitte, Datawheel, and MIT has produced an intuitive aesthetically-pleasing gathering point for public data in the United States. Specific locations and industries boast easy-to-read profiles.

Planetizen Federal Action Tracker
A weekly monitor of how Trump’s orders and actions are impacting planners and planning in America.

Maui's Vacation Rental Debate Turns Ugly
Verbal attacks, misinformation campaigns and fistfights plague a high-stakes debate to convert thousands of vacation rentals into long-term housing.

San Francisco Suspends Traffic Calming Amidst Record Deaths
Citing “a challenging fiscal landscape,” the city will cease the program on the heels of 42 traffic deaths, including 24 pedestrians.

Amtrak Rolls Out New Orleans to Alabama “Mardi Gras” Train
The new service will operate morning and evening departures between Mobile and New Orleans.

The Subversive Car-Free Guide to Trump's Great American Road Trip
Car-free ways to access Chicagoland’s best tourist attractions.

San Antonio and Austin are Fusing Into one Massive Megaregion
The region spanning the two central Texas cities is growing fast, posing challenges for local infrastructure and water supplies.
Urban Design for Planners 1: Software Tools
This six-course series explores essential urban design concepts using open source software and equips planners with the tools they need to participate fully in the urban design process.
Planning for Universal Design
Learn the tools for implementing Universal Design in planning regulations.
Heyer Gruel & Associates PA
JM Goldson LLC
Custer County Colorado
City of Camden Redevelopment Agency
City of Astoria
Transportation Research & Education Center (TREC) at Portland State University
Jefferson Parish Government
Camden Redevelopment Agency
City of Claremont