


A new animated map presents the reported cases of potholes in Chicago since November—the maps colorful and provides insights into how the city, and our relationship to it, can change with time.
Vikki Ortiz Healy reports for the Chicago Tribune about a new animated map of pothole reports from November to this week in the city of Chicago. To create the map, Elliott Ramos downloaded data from the city of Chicago’s website, “which meticulously documents all pothole reports.”
The map blinks like a Christmas tree as the number and density of reported potholes expands and contracts with time. January through February, for instance, might require sunglasses for viewing given the density of reported potholes.
According to Healy’s article, Ramos created the visualization to help residents understand the nuances of how data manifests around the city. “At a wide glance, Ramos’ map, which took him less than an hour to create, shows an orange dot for each pothole report. The orange fades to yellow/pink as time elapses. The point, he said, is to demonstrate how the number of pothole reports changes over time, and that there can be days with a surge of reportings — such as just after Jan. 1 or at Jan. 15 — perhaps when more people are home to notice or are inspired by media reports,” writes Healy.
FULL STORY: Where are the most pot holes in the city? There's an app for that.

A Central Hub for Open Data
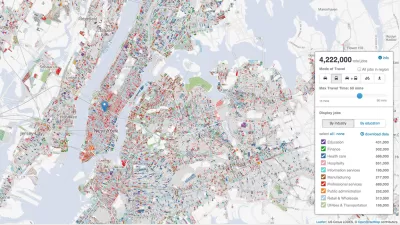
Designed by researchers at the University of Chicago, the Plenario platform gathers all available open data for a specific area. Then it presents the data in an easy-to-use format.
The Growing Importance of Location Intelligence
Location intelligence is transforming decision-making, with an increasing number and type of organizations modernizing operations with a geographic approach to problem-solving, planning, and prediction.

Real-Time Art Installation Reveals the Many Dimensions of Data
Using a wagon filled with phones, an artist in Berlin demonstrated the disconnect between data and the real world.

Planetizen Federal Action Tracker
A weekly monitor of how Trump’s orders and actions are impacting planners and planning in America.

Congressman Proposes Bill to Rename DC Metro “Trump Train”
The Make Autorail Great Again Act would withhold federal funding to the system until the Washington Metropolitan Area Transit Authority (WMATA), rebrands as the Washington Metropolitan Authority for Greater Access (WMAGA).

The Simple Legislative Tool Transforming Vacant Downtowns
In California, Michigan and Georgia, an easy win is bringing dollars — and delight — back to city centers.

The States Losing Rural Delivery Rooms at an Alarming Pace
In some states, as few as 9% of rural hospitals still deliver babies. As a result, rising pre-term births, no adequate pre-term care and harrowing close calls are a growing reality.

The Small South Asian Republic Going all in on EVs
Thanks to one simple policy change less than five years ago, 65% of new cars in this Himalayan country are now electric.

DC Backpedals on Bike Lane Protection, Swaps Barriers for Paint
Citing aesthetic concerns, the city is removing the concrete barriers and flexposts that once separated Arizona Avenue cyclists from motor vehicles.
Urban Design for Planners 1: Software Tools
This six-course series explores essential urban design concepts using open source software and equips planners with the tools they need to participate fully in the urban design process.
Planning for Universal Design
Learn the tools for implementing Universal Design in planning regulations.
Smith Gee Studio
City of Charlotte
City of Camden Redevelopment Agency
City of Astoria
Transportation Research & Education Center (TREC) at Portland State University
US High Speed Rail Association
City of Camden Redevelopment Agency
Municipality of Princeton (NJ)