


Wired profiles Charles Komanoff, who's hoping to use his immense spreadsheet of New York City traffic data to clear the city's congestion.
Komanoff's been trying to measure how traffic affects the city and its people, from time lost to money spent. He also has an eye on how understanding the patterns of transportation in the city can help improve its flows.
"Komanoff will use this interview to inform his magnum opus, the Balanced Transportation Analyzer, an enormous Excel spreadsheet that he's been building for the past three years. Over the course of about 50 worksheets, the BTA breaks down every aspect of New York City transportation-subway revenues, traffic jams, noise pollution-in an attempt to discover which mix of tolls and surcharges would create the greatest benefit for the largest number of people.
Komanoff's spreadsheet, which he has posted online, calculates how new fees and changes to existing tolls affect traffic at different times of day. It calculates which costs are borne by city dwellers and which by suburbanites. It calculates how long it takes passengers to dig for change and board buses. And it allows any user to adjust dozens of different variables-from taxi surcharges to truck tolls-and measure their impact. The result is a kind of statistical SimCity, an opportunity to play God (or at least Robert Moses) and devise the perfect traffic policy."
FULL STORY: The Man Who Could Unsnarl Manhattan Traffic


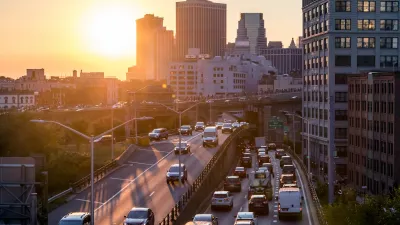
Judge Extends NYC Congestion Pricing Through at Least June 9
A federal judge halted the Trump administration’s effort to kill the program, which remains in limbo as a lawsuit filed by the MTA moves forward.

NYC Congestion Pricing Continues to Show Positive Results
While the Trump administration attempts to revoke the program’s federal approval, congestion pricing continues to reduce traffic, speed up bus travel times, and improve air quality in Manhattan.
USDOT Threatens to Pull New York Highway Funding
The Trump administration wants the state to kill New York City’s congestion pricing program despite its demonstrated success.

Maui's Vacation Rental Debate Turns Ugly
Verbal attacks, misinformation campaigns and fistfights plague a high-stakes debate to convert thousands of vacation rentals into long-term housing.

Planetizen Federal Action Tracker
A weekly monitor of how Trump’s orders and actions are impacting planners and planning in America.

San Francisco Suspends Traffic Calming Amidst Record Deaths
Citing “a challenging fiscal landscape,” the city will cease the program on the heels of 42 traffic deaths, including 24 pedestrians.

Defunct Pittsburgh Power Plant to Become Residential Tower
A decommissioned steam heat plant will be redeveloped into almost 100 affordable housing units.

Trump Prompts Restructuring of Transportation Research Board in “Unprecedented Overreach”
The TRB has eliminated more than half of its committees including those focused on climate, equity, and cities.

Amtrak Rolls Out New Orleans to Alabama “Mardi Gras” Train
The new service will operate morning and evening departures between Mobile and New Orleans.
Urban Design for Planners 1: Software Tools
This six-course series explores essential urban design concepts using open source software and equips planners with the tools they need to participate fully in the urban design process.
Planning for Universal Design
Learn the tools for implementing Universal Design in planning regulations.
Heyer Gruel & Associates PA
JM Goldson LLC
Custer County Colorado
City of Camden Redevelopment Agency
City of Astoria
Transportation Research & Education Center (TREC) at Portland State University
Jefferson Parish Government
Camden Redevelopment Agency
City of Claremont