


"Level of service" is a ranking used by transportation engineers to assess the performance of roads. Streetsblog argues that LOS distorts the development of mobility infrastructure by prioritizing cars over people.
"There's a dirty little secret you should know about San Francisco: It's engineered first and foremost for automobility and will never be able to shed this bias if the traffic engineers are in the driver's seat wielding their traffic analysis tools like bibles. As long as the city continues prioritizing the use of transportation analysis known as Level of Service (LOS), you might as well burn our Transit First policy for warmth.
"On the one hand, LOS is a very simple and blunt metric for understanding the speed that vehicles can move about the city. LOS measures the amount of vehicular delay at an intersection, with A through F grades assigned to increased delay. This measurement is taken during the peak 15 minutes of evening rush hour and if an intersection slips from LOS D to LOS E, traffic managers will try to mitigate the impact, which usually means widening the road, shrinking the sidewalks, removing crosswalks, softening turning angles, and adjusting signal timing to speed the movement of vehicles.
"The result of relying on this poor methodology to shape the growth of cities has a profound affect on the politics of human mobility, privileging the movement of vehicles before the movement of anything else. Quite simply, LOS analysis has given us Phoenix and Atlanta, congestion and ever-longer commutes, and a whole host of ills that accompany reliance on the inefficient use of street space for our cars."
Thanks to George Osner, AICP
FULL STORY: Paradise LOSt (Part I): How Long Will the City Keep Us Stuck in Our Cars?

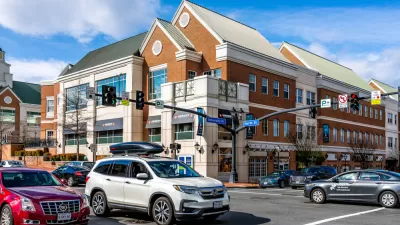
Shifting the Focus for Transportation Planning in Fairfax County
Fairfax County wants to move away from a heavy reliance on level of service in favor of more pedestrian- and transit-oriented planning.

Opinion: Transportation Funding Priorities Are Outdated
Investing in technology and promoting innovation in the transportation sector can further the Biden administration's goals of reducing carbon emissions and improving public transit.
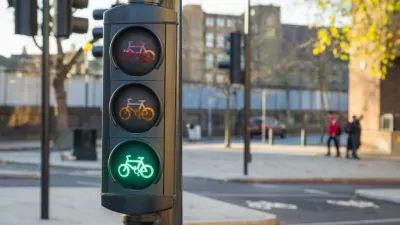
This is How the British Started Cycling More
Cycling has never felt more relevant or encouraged in the UK. Since May, the London Councils have upgraded 60 km of bike lanes in the capital city, added 20,000 square metres of extra pavement space, and installed 1,500+ additional cycle parking.

Maui's Vacation Rental Debate Turns Ugly
Verbal attacks, misinformation campaigns and fistfights plague a high-stakes debate to convert thousands of vacation rentals into long-term housing.

Planetizen Federal Action Tracker
A weekly monitor of how Trump’s orders and actions are impacting planners and planning in America.

In Urban Planning, AI Prompting Could be the New Design Thinking
Creativity has long been key to great urban design. What if we see AI as our new creative partner?

Portland Raises Parking Fees to Pay for Street Maintenance
The city is struggling to bridge a massive budget gap at the Bureau of Transportation, which largely depleted its reserves during the Civd-19 pandemic.

Spokane Mayor Introduces Housing Reforms Package
Mayor Lisa Brown’s proposals include deferring or waiving some development fees to encourage more affordable housing development.

Houston Mayor Kills Another Bike Lane
The mayor rejected a proposed bike lane in the Montrose district in keeping with his pledge to maintain car lanes.
Urban Design for Planners 1: Software Tools
This six-course series explores essential urban design concepts using open source software and equips planners with the tools they need to participate fully in the urban design process.
Planning for Universal Design
Learn the tools for implementing Universal Design in planning regulations.
Gallatin County Department of Planning & Community Development
Heyer Gruel & Associates PA
JM Goldson LLC
City of Camden Redevelopment Agency
City of Astoria
Transportation Research & Education Center (TREC) at Portland State University
Jefferson Parish Government
Camden Redevelopment Agency
City of Claremont