


The recent spill of 210,000 gallons of crude oil from the Keystone pipeline in South Dakota was far from an outlier.

Jonathan Thompson follows the news from earlier in the week that the Nebraska Public Service Commission had authorized the Keystone XL oil pipeline through the state by presenting on infographic that illustrates the scale of the environmental threat represented by oil pipelines.
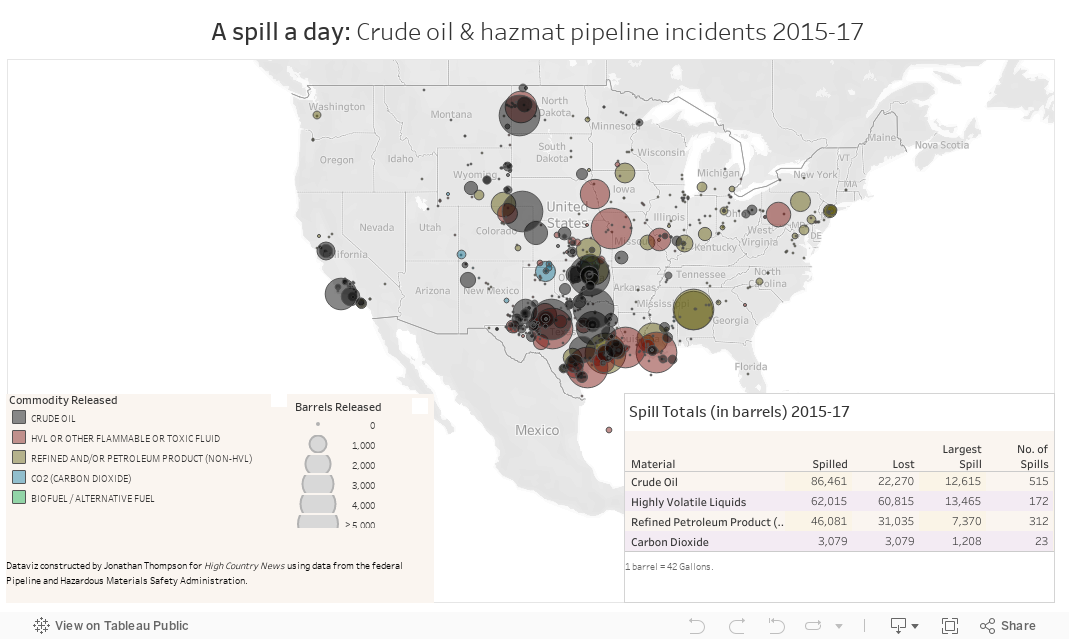
"Pipelines are often touted as safer than train or truck for transporting oil and other hazardous materials. But over the last two-and-a-half years, crude oil and hazardous materials pipelines across the U.S. busted at a rate of more than once per day, through corrosion, floods, lightning, vehicles and vandals," writes Thompson.
"Some 3.6 million gallons of crude oil spilled in total, and five oil spills were as large or larger than the Keystone incident," writes Thompson, referring to an incident earlier in November that spilled 5,000 barrels, or 210,000 gallons, of crude oil from the Keystone Pipeline in South Dakota.
To illustrate this point, Thompson also shares the infographic shown below, which gathers all the crude oil spills between 2015 and 2017 onto one busy map of the United States.
FULL STORY: Nationwide, oil pipeline spills are a near-daily reality

Tar Sands Oil Just Lost Another Outlet, For Now
It was viewed as a "David vs. Goliath" pipeline fight: the city of South Portland, Maine against a pipeline company backed by Big Oil. The city had passed a zoning ordinance preventing the export of oil which would have impacted public health.
Keystone Pipeline Leaks Oil in Advance of Crucial Decision on Sister Pipeline
Thursday's massive oil spill in South Dakota is not a good omen for TransCanada for a favorable decision on Monday on an application before the Nebraska Public Service Commission on the routing of the controversial Keystone XL pipeline.
The Geography of Oil and Gas Pipeline Accidents [Updated]
Safety is one trigger in the heated debate over whether fossil fuels should be transported by pipeline. While the industry insists the method is safer than others, the spread of accidents since 1986 is substantial.

Planetizen Federal Action Tracker
A weekly monitor of how Trump’s orders and actions are impacting planners and planning in America.

Maui's Vacation Rental Debate Turns Ugly
Verbal attacks, misinformation campaigns and fistfights plague a high-stakes debate to convert thousands of vacation rentals into long-term housing.

San Francisco Suspends Traffic Calming Amidst Record Deaths
Citing “a challenging fiscal landscape,” the city will cease the program on the heels of 42 traffic deaths, including 24 pedestrians.

Amtrak Rolls Out New Orleans to Alabama “Mardi Gras” Train
The new service will operate morning and evening departures between Mobile and New Orleans.

The Subversive Car-Free Guide to Trump's Great American Road Trip
Car-free ways to access Chicagoland’s best tourist attractions.

San Antonio and Austin are Fusing Into one Massive Megaregion
The region spanning the two central Texas cities is growing fast, posing challenges for local infrastructure and water supplies.
Urban Design for Planners 1: Software Tools
This six-course series explores essential urban design concepts using open source software and equips planners with the tools they need to participate fully in the urban design process.
Planning for Universal Design
Learn the tools for implementing Universal Design in planning regulations.
Heyer Gruel & Associates PA
JM Goldson LLC
Custer County Colorado
City of Camden Redevelopment Agency
City of Astoria
Transportation Research & Education Center (TREC) at Portland State University
Jefferson Parish Government
Camden Redevelopment Agency
City of Claremont