


A new CincyInsights dashboard shows recycling participation rates all over the city.
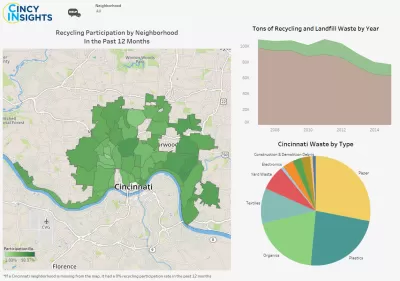
The Cincinnati Office of Performance and Data Analytics (OPDA) and the Office of Environment and Sustainability (OES) have created a new dashboard that shows recycling participation rates at the neighborhood level for the entire city.
The "CincyInsight: Recycling Participation" dashboard actually shares two kinds of information: 1) "an overview of neighborhood recycling participation for the past 12 months, and a summary of waste types and tonnage," and 2) individual address recycling participation. On that second count, "users may search by street and ZIP code, and change the date range to see recycling participation data as far back as January 2016."
"The data powering this new feature is generated by RFID technology, which enables the City to track each time a City-issued recycling bin is lifted," according to n announcement of the new dashboard posted on the city's website.
The new recycling participation dashboard is the latest in a series—the total number of CincyInsights dashboards now reaches 18, and the city is soliciting ideas for new dashboards.
FULL STORY: City Debuts New Neighborhood-based Recycling Participation Dashboard


New Interactive Mapping Tool Tracks all of NYC's Infrastructure Projects, Housing Permits, and City Facilities
The New York Department of City Planning has taken its open data practices to a new level with the launch of the Capital Planning Explorer.

Measuring Job Densification Trends in U.S. Metropolitan Areas
A new report details the trend of jobs densification in U.S. metropolitan areas between 2004 and 2015, finding a few large metropolitan areas leading an overall increase in jobs density. Still, many areas are seeing jobs disperse around the region.

Compare Transit Ridership in U.S. Cities
A new interactive tool called Transit Insights offers access to the local trends of transit ridership.

Planetizen Federal Action Tracker
A weekly monitor of how Trump’s orders and actions are impacting planners and planning in America.

Maui's Vacation Rental Debate Turns Ugly
Verbal attacks, misinformation campaigns and fistfights plague a high-stakes debate to convert thousands of vacation rentals into long-term housing.

San Francisco Suspends Traffic Calming Amidst Record Deaths
Citing “a challenging fiscal landscape,” the city will cease the program on the heels of 42 traffic deaths, including 24 pedestrians.

Defunct Pittsburgh Power Plant to Become Residential Tower
A decommissioned steam heat plant will be redeveloped into almost 100 affordable housing units.

Trump Prompts Restructuring of Transportation Research Board in “Unprecedented Overreach”
The TRB has eliminated more than half of its committees including those focused on climate, equity, and cities.

Amtrak Rolls Out New Orleans to Alabama “Mardi Gras” Train
The new service will operate morning and evening departures between Mobile and New Orleans.
Urban Design for Planners 1: Software Tools
This six-course series explores essential urban design concepts using open source software and equips planners with the tools they need to participate fully in the urban design process.
Planning for Universal Design
Learn the tools for implementing Universal Design in planning regulations.
Heyer Gruel & Associates PA
JM Goldson LLC
Custer County Colorado
City of Camden Redevelopment Agency
City of Astoria
Transportation Research & Education Center (TREC) at Portland State University
Jefferson Parish Government
Camden Redevelopment Agency
City of Claremont