


On the cusp of a new infrastructure proposal from the White House, how has federal spending changed over the last 70 years? What will it take to reach historical averages?
Following up on this article published for Infrastructure Week last year, Jeff Davis takes a look at federal infrastructure spending with an eye for what it would take to match historical levels. For the most part, these numbers look at federal grants as a percentage of total U.S. GDP.
Some highlights from the latter half of the 20th century include the 1956 Interstate Highway law, tripling infrastructure grants as a share of GDP, as well as the 1972 Clean Water Act, "which provided an at-the-time staggering amount of $18 billion in general fund contract authority for sewer grants, and the 1970 and 1974 mass transit laws."
Davis notes that the apparent decline in water grants during the 1980s is misleading: "in 1987, the Clean Water Act switched away from making sewer grants to localities and instead started using federal money to endow state revolving funds to make low-interest loans to localities."
Today, Davis concludes, "equivalent total spending to hit the 1957-1986 average would be $92 billion per year, the total spending to maintain the average of the last 30 years (1987-2016) would be $69 billion per year, and the total spending to maintain the average spending level of the last 60 years would be $80.7 billion per year."
FULL STORY: Infrastructure Week Preview – Federal Infrastructure Grants: How to Get Back to “Average?”


The Path to Hyperdensity
The federal government has an opportunity to make a generational investment in the country's infrastructure that could fundamentally shift the way we live and move around cities.
Trump's Infrastructure and Budget Plans Spell Doom for the Highway Trust Fund
Analysis from the Center for American Progress breaks down the fallout in funding and job losses to the state level, if policies proposed in the Trump Administration's infrastructure plan and its proposed budget for fiscal year 2018 are adopted.
Op-Ed: On the Pitfalls of Federal Spending
Charles Marohn of Strong Towns makes the case that whoever's in the White House, simply increasing federal spending on infrastructure isn't the wisest move.

Planetizen Federal Action Tracker
A weekly monitor of how Trump’s orders and actions are impacting planners and planning in America.

Chicago’s Ghost Rails
Just beneath the surface of the modern city lie the remnants of its expansive early 20th-century streetcar system.
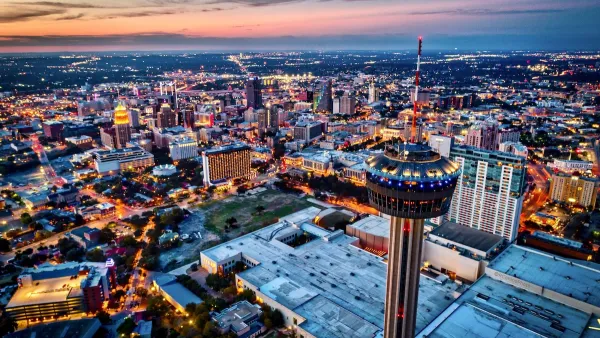
San Antonio and Austin are Fusing Into one Massive Megaregion
The region spanning the two central Texas cities is growing fast, posing challenges for local infrastructure and water supplies.

Since Zion's Shuttles Went Electric “The Smog is Gone”
Visitors to Zion National Park can enjoy the canyon via the nation’s first fully electric park shuttle system.

Trump Distributing DOT Safety Funds at 1/10 Rate of Biden
Funds for Safe Streets and other transportation safety and equity programs are being held up by administrative reviews and conflicts with the Trump administration’s priorities.

German Cities Subsidize Taxis for Women Amid Wave of Violence
Free or low-cost taxi rides can help women navigate cities more safely, but critics say the programs don't address the root causes of violence against women.
Urban Design for Planners 1: Software Tools
This six-course series explores essential urban design concepts using open source software and equips planners with the tools they need to participate fully in the urban design process.
Planning for Universal Design
Learn the tools for implementing Universal Design in planning regulations.
planning NEXT
Appalachian Highlands Housing Partners
Mpact (founded as Rail~Volution)
City of Camden Redevelopment Agency
City of Astoria
City of Portland
City of Laramie