


The ability to predict severe weather events would be a huge benefit to planners, preparing for a new era of resilience. A new study sheds new light on how much rain we can expect, and where, on a warmer planet.
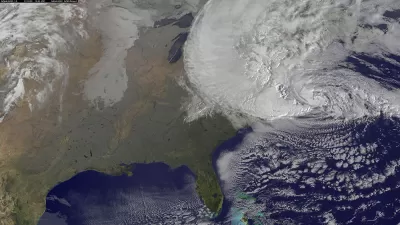
"A new study by researchers from MIT and the Swiss Federal Institute of Technology in Zurich shows that the most extreme rain events in most regions of the world will increase in intensity by 3 to 15 percent, depending on region, for every degree Celsius that the planet warms," reports Jennifer Chu for the MIT News Office.
"If global average temperatures rise by 4 degrees Celsius over the next hundred years, as many climate models predict given relatively high CO2 emissions, much of North America and Europe would experience increases in the intensity of extreme rainfall of roughly 25 percent," adds Chu.
So far, climate modeling has shown extreme weather as a global trend, but the new study begins to reduce the scale of the weather predictions, at the level of continents and even smaller. In doing so, researchers "found that, overall, it was the changes in winds, and not water vapor, that determined the region-to-region variations in the change in extreme rain intensity."
The study was published yesterday in the Nature Climate Change journal.
FULL STORY: Varied increases in extreme rainfall with global warming


Planning Year in Review 2024: An Ongoing Housing Crisis, the Fight for Climate Resilience, and a Mixed Bag for Transportation
A pedestrian safety crisis, rising housing instability, and destructive extreme weather events set the stage for an eventful year.

Key Climate and Health Issues to Watch in 2025
The escalating health impacts of climate change, from extreme heat to sea level rise, highlight the urgent need for integrated medical education, proactive communication, and sustainable policy solutions to protect public health.

Rebuilding America's Backbone: A Call for Resilient Infrastructure
How sustainable investments in infrastructure made today can secure the future.

Maui's Vacation Rental Debate Turns Ugly
Verbal attacks, misinformation campaigns and fistfights plague a high-stakes debate to convert thousands of vacation rentals into long-term housing.

Planetizen Federal Action Tracker
A weekly monitor of how Trump’s orders and actions are impacting planners and planning in America.

In Urban Planning, AI Prompting Could be the New Design Thinking
Creativity has long been key to great urban design. What if we see AI as our new creative partner?

Massachusetts Budget Helps Close MBTA Budget Gap
The budget signed by Gov. Maura Healey includes $470 million in MBTA funding for the next fiscal year.

Milwaukee Launches Vision Zero Plan
Seven years after the city signed its Complete Streets Policy, the city is doubling down on its efforts to eliminate traffic deaths.

Portland Raises Parking Fees to Pay for Street Maintenance
The city is struggling to bridge a massive budget gap at the Bureau of Transportation, which largely depleted its reserves during the Civd-19 pandemic.
Urban Design for Planners 1: Software Tools
This six-course series explores essential urban design concepts using open source software and equips planners with the tools they need to participate fully in the urban design process.
Planning for Universal Design
Learn the tools for implementing Universal Design in planning regulations.
Gallatin County Department of Planning & Community Development
Heyer Gruel & Associates PA
JM Goldson LLC
City of Camden Redevelopment Agency
City of Astoria
Transportation Research & Education Center (TREC) at Portland State University
Jefferson Parish Government
Camden Redevelopment Agency
City of Claremont