


A new set of tools from the U.C. Berkeley Terner Center for Housing Innovation offers insight into how projects fit into the policy landscape, as well as how changes to the policy landscape could impact development.

"We need a tool that can help us to more objectively assess and weigh our multiple policy objectives, from ensuring we have housing for families with a wide range of income levels, to reducing the time people have to spend in their car to get to work," explains a post by Carol Galante on the Terner Center for Housing Innovation blog. The reason for the blog post, however, isn't an appeal. It's an announcement. The Terner Center actually built that tool.
The Housing Development Dashboard, as it's called, "has the potential to significantly reshape how we engage in the housing development debate in cities across the country," writes Galante, by offering "an interactive platform that allows policymakers, developers, and members of the public to quickly and easily understand the interaction of land use measures and market conditions on housing production."
The dashboard actually includes two tools, both described by Galante. One is the Development Calculator, which estimates the probability of delivery for a given project. The second is the Policy Gauge, which "assesses the cumulative impact that a policy change might have on housing production across an entire jurisdiction." Galante also promises to share results from the dashboard as the Terner Center deploys it in real world scenarios.
FULL STORY: Launching the Housing Development Dashboard


Canada vs. Kamala: Whose Liberal Housing Platform Comes Out on Top?
As Canada votes for a new Prime Minister, what can America learn from the leading liberal candidate of its neighbor to the north?
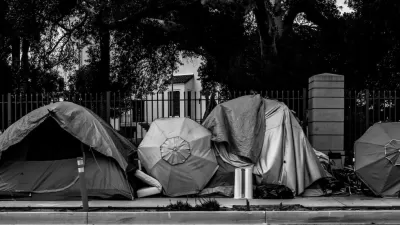
Trump Wants to Force Homeless People Into ‘Tent Cities.’ Can He?
The president pushed for sweeping crackdowns and the possible internment of people experiencing homelessness. To see what's coming, we should look to what states have already done.

What Is ‘Affordable Housing’?
For such a commonly used term, “affordable housing” means a lot of different things to different people and in different contexts.For such a commonly used term, “affordable housing” means a lot of different things to different people and in different contexts.

Planetizen Federal Action Tracker
A weekly monitor of how Trump’s orders and actions are impacting planners and planning in America.

Map: Where Senate Republicans Want to Sell Your Public Lands
For public land advocates, the Senate Republicans’ proposal to sell millions of acres of public land in the West is “the biggest fight of their careers.”

Restaurant Patios Were a Pandemic Win — Why Were They so Hard to Keep?
Social distancing requirements and changes in travel patterns prompted cities to pilot new uses for street and sidewalk space. Then it got complicated.

Platform Pilsner: Vancouver Transit Agency Releases... a Beer?
TransLink will receive a portion of every sale of the four-pack.

Toronto Weighs Cheaper Transit, Parking Hikes for Major Events
Special event rates would take effect during large festivals, sports games and concerts to ‘discourage driving, manage congestion and free up space for transit.”

Berlin to Consider Car-Free Zone Larger Than Manhattan
The area bound by the 22-mile Ringbahn would still allow 12 uses of a private automobile per year per person, and several other exemptions.
Urban Design for Planners 1: Software Tools
This six-course series explores essential urban design concepts using open source software and equips planners with the tools they need to participate fully in the urban design process.
Planning for Universal Design
Learn the tools for implementing Universal Design in planning regulations.
Heyer Gruel & Associates PA
JM Goldson LLC
Custer County Colorado
City of Camden Redevelopment Agency
City of Astoria
Transportation Research & Education Center (TREC) at Portland State University
Camden Redevelopment Agency
City of Claremont
Municipality of Princeton (NJ)