


Google Earth can be a useful tool for understanding how parking is being used in your community and to identify where over- or under-utilization occurs.

Last year I shared how Google Earth can be used to understand parking utilization. In response, readers suggested that Google Earth can be used for walking audits and offered that Remote Sensing Metrics is another resources for parking utilization data. Patrick Holland, a Master's in City and Regional Planning student at Ohio State University, Gala Korniyenko, a Master's of Urban Planning student at the University of Kansas, and Brittany Port, an Ohio State University graduate of the Master's in City and Regional Planning program, along with myself, looked at Google Earth image after Google Earth image to understand parking utilization at large scale retailers.
We looked at 104 retailers in 17 different communities in the Columbus, Ohio metro area. The sites selected included a grocery store or big box retailer, including both urban and suburban sites. Sites were selected based on a Google Maps search for common grocery and big box retailers in each region. Parking lots were observed from 2002 to 2014, and most of the Google Earth data is from 2004, 2007, 2010, and 2014.
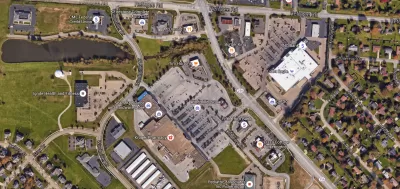
For each retailer, we pulled up the location in Google Earth. For example, for the Costco at 1500 Gemini Place in Columbus, Google Earth has aerial imagery of the site on 20 occasions since 1988, of which five have been captured since the date the Costco opened. In some cases the imagery had insufficient clarity to accurately count vehicles, these were discarded. In total there were 394 Google Earth images analyzed.

Google Earth image of Costco at 1500 Gemini Place in Columbus, Ohio on June 13, 2014.
All of the locations observed had more parking than was demanded. Across the 394 observations of parking lots, the average parking lot was 28 percent occupied. The highest utilization rate observed was 69 percent. Important to note is that none of the observations were on the peak days, such as Black Friday, nor at night. The observations capture typical daytime utilization rates.
In terms of days, Monday had the lowest parking utilization rate at 16 percent. This is no surprise, because Monday is typically a slow day for retailers. On the other end of the spectrum, Thursday had the highest parking utilization rate of 32 percent.
After comparing parking utilization on a time schedule, lots are most full during between 2 pm and 3 pm. During this time period the parking lots were 40 percent occupied. We had insufficient imagery from 4 to 6 pm, with only two stores with images showing an average of 43 percent. Daily eyeball surveys of Kroger and Giant Eagle parking lots from Powell, Ohio's zoning inspector estimate their parking lots to be 40 percent full at 5:30 p.m. These estimations are consistent with what we say from the Google Earth imagery.
Parking lots were more utilized at urban sites. Urban stores had an average 46 percent occupancy, which inner ring suburbs experienced 38 percent occupancy, and outer suburbs at 26 percent occupancy.
When parking utilization is broken down by retailer, Whole Foods came out on top with an average parking utilization rate of 43 percent. Meijer had the lowest parking utilization of all the retailers at 20 percent.
- Costco: 39 percent
- Kroger: 37 percent
- Home Depot: 24 percent
- Meijer: 21 percent
- Sam’s Club: 25 percent
- Target: 22 percent
- Wal-Mart: 37 percent
- Whole Foods: 43 percent
This could have to do with the number of parking spaces, location, or other factors. In all cases, the stores have more parking spaces than required by city code. For example, Meijer had 67 percent more spaces than required, while Home Depot had 5.7 percent more spaces. Michael Davidson and Fay Dolnick, in their American Planning Association Advisory Service Report on Parking Standards, lay out suggested parking standards. In the case of Whole Foods, their stores in the Columbus metropolitan area have parking that is on par with the recommendations, while Meijer has 300 percent more parking and Walmart 200 percent more than recommended.
Whether or not the building was free standing or part of a larger shopping center had a slight impact on parking utilization. Freestanding buildings achieved an average parking utilization of 28 percent while buildings that were part of a shopping center accomplished a parking utilization of 34 percent.
The community where stores are located also matters. The city of Worthington had the highest overall utilization at 52 percent. The city's Planned Unit Development guidelines limit retailers to no more than 120 percent of the parking permitted by code to limit excess parking. While the city of Pickerington, with the lowest utilization rate of 20 percent, does not have any maximum parking requirements.
The results of this study are similar to results found from traditional on the ground counts. The benefit of using Google Earth is the ease of data access over time and across communities. Google Earth can be a helpful tool for understanding parking utilization and the effectiveness of parking regulations.
Has your community studied its parking utilization? Has your community modified its requirements to bring the parking supply into better alignment with parking demand? Share in the comments section below.

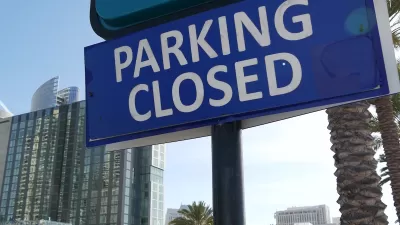
Opinion: Cities Must Take Action on Blighted Downtown Parking Lots
Surface parking lots take up as much as a third of downtown land in some cities, dragging down tax revenue and redevelopment prospects.
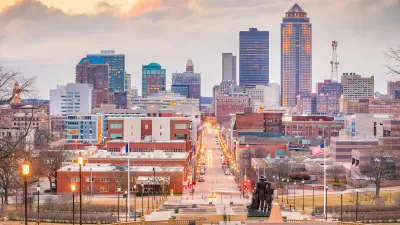
Des Moines Plans to Repurpose Downtown Parking Lots
City officials want to encourage the redevelopment of underused surface parking lots.
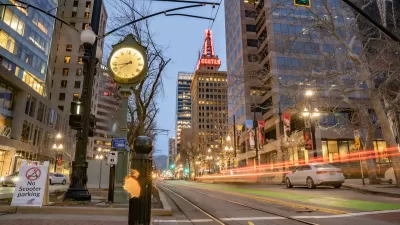
One-Third of Downtown Salt Lake City Devoted to Parking
A new map highlights prime downtown real estate that could be repurposed for more productive uses.

Planetizen Federal Action Tracker
A weekly monitor of how Trump’s orders and actions are impacting planners and planning in America.

Restaurant Patios Were a Pandemic Win — Why Were They so Hard to Keep?
Social distancing requirements and changes in travel patterns prompted cities to pilot new uses for street and sidewalk space. Then it got complicated.

Map: Where Senate Republicans Want to Sell Your Public Lands
For public land advocates, the Senate Republicans’ proposal to sell millions of acres of public land in the West is “the biggest fight of their careers.”

Maui's Vacation Rental Debate Turns Ugly
Verbal attacks, misinformation campaigns and fistfights plague a high-stakes debate to convert thousands of vacation rentals into long-term housing.

San Francisco Suspends Traffic Calming Amidst Record Deaths
Citing “a challenging fiscal landscape,” the city will cease the program on the heels of 42 traffic deaths, including 24 pedestrians.

California Homeless Arrests, Citations Spike After Ruling
An investigation reveals that anti-homeless actions increased up to 500% after Grants Pass v. Johnson — even in cities claiming no policy change.
Urban Design for Planners 1: Software Tools
This six-course series explores essential urban design concepts using open source software and equips planners with the tools they need to participate fully in the urban design process.
Planning for Universal Design
Learn the tools for implementing Universal Design in planning regulations.
Heyer Gruel & Associates PA
JM Goldson LLC
Custer County Colorado
City of Camden Redevelopment Agency
City of Astoria
Transportation Research & Education Center (TREC) at Portland State University
Camden Redevelopment Agency
City of Claremont
Municipality of Princeton (NJ)