


The Wonkblog team puts new American Community Survey data to good use.

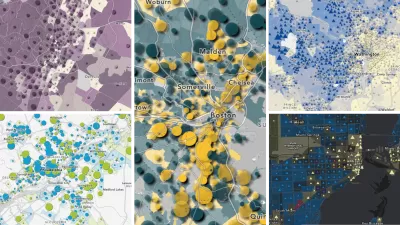
Katie Park, Ted Mellnik, and Emily Badger team up to share an interactive map (with data recently released from the American Community Survey) that illustrates the commutes of the 38 million Americans that cross county boundaries on their way to work.
"In the District of Columbia, for instance, about 95,000 workers come in each day from Fairfax County. Nearly 140,000 do from Prince George's County."
The article notes the limiting survey question that gathered the data: "At what person did this person work last week?"—which means that the data "may also capture a D.C. resident who went to a convention in Chicago the previous week, or a long-distance trucker who lives in California but spent that week driving across Ohio."
But there is still a lot to be gleaned from the map: "people from all over the upper Great Plains who spend Monday through Friday each week at lucrative fracking jobs in McKenzie County, North Dakota, or oil-industry hands who fly back and forth to Alaska's North Slope, or workers in the District who'd rather buy the bigger home they can afford in Pennsylvania."
FULL STORY: Where Americans go to work when they don’t work near home


DataUSA: An Intuitive Tool for Public Data
A collaboration between Deloitte, Datawheel, and MIT has produced an intuitive aesthetically-pleasing gathering point for public data in the United States. Specific locations and industries boast easy-to-read profiles.
Explore US Demographics With the New ACS Atlas Collection
Esri's new ACS Atlas Collection offers interactive applications that visualize the latest U.S. demographic and socio-economic data, enabling users to explore over 175 curated web maps across various thematic areas.

A Milestone for the American Community Survey
After releasing new five-year estimates this week, the American Community Survey now offers three sets of five-year data that don't overlap, providing even more data for the analysis of local trends.

Planetizen Federal Action Tracker
A weekly monitor of how Trump’s orders and actions are impacting planners and planning in America.

Chicago’s Ghost Rails
Just beneath the surface of the modern city lie the remnants of its expansive early 20th-century streetcar system.

San Antonio and Austin are Fusing Into one Massive Megaregion
The region spanning the two central Texas cities is growing fast, posing challenges for local infrastructure and water supplies.

Since Zion's Shuttles Went Electric “The Smog is Gone”
Visitors to Zion National Park can enjoy the canyon via the nation’s first fully electric park shuttle system.

Trump Distributing DOT Safety Funds at 1/10 Rate of Biden
Funds for Safe Streets and other transportation safety and equity programs are being held up by administrative reviews and conflicts with the Trump administration’s priorities.

German Cities Subsidize Taxis for Women Amid Wave of Violence
Free or low-cost taxi rides can help women navigate cities more safely, but critics say the programs don't address the root causes of violence against women.
Urban Design for Planners 1: Software Tools
This six-course series explores essential urban design concepts using open source software and equips planners with the tools they need to participate fully in the urban design process.
Planning for Universal Design
Learn the tools for implementing Universal Design in planning regulations.
planning NEXT
Appalachian Highlands Housing Partners
Mpact (founded as Rail~Volution)
City of Camden Redevelopment Agency
City of Astoria
City of Portland
City of Laramie