


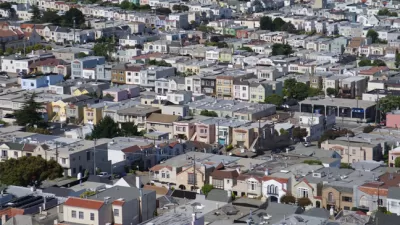
Many studies have measured and compared the sprawl of U.S. metropolitan areas. A recent study tracks the rate at which the same cities grew either less compact or more compact for the decade between 2000 and 2010.
Eric Jaffe shares the details of a new report by Reid Ewing and Shima Hamidi of the University of Utah that tracks the rate of sprawl for the largest 162 urbanized areas in the United States. According to Jaffe's telling, "Ewing and Hamidi scored the largest 162 U.S. urbanized areas on the Sprawl Index — or, if you're feeling optimistic, the Compactness Index — for 2010. (Urbanized areas reflect development better than fixed metro area boundaries do.) Then they applied the index to the same cities in 2000 to show the change over time."
Jaffe's coverage of the study includes maps and, most helpfully, graphs, which quantifies the rate of sprawl for urban areas around the country. The data reveals for instance, that the country's most compact area, San Francisco-Oakland, actually became less compact between 2000 and 2010. At the other end of the spectrum, the least compact city, Atlanta, became less compact still.
The article concludes by describing the possible policy implications of the study.
FULL STORY: The U.S. Cities That Sprawled the Most (and Least) Between 2000 and 2010

SPUR: The Bay Area Has A Sprawl Problem
SPUR states its case clearly by announcing, “We believe cities are the key to our future” at the opening of a new report called “SPUR’s Agenda for Change.”
A Detailed History of Atlanta's 'War on Density'
The Atlanta Studies website takes a deep dive into the history that produced the city of Atlanta as we know it today—and provides some suggestions on how to "correct some of its most atrocious attacks on the urban built environment."

Where Los Angeles Equals San Francisco's Density
Though the Los Angeles region is very dense, significant barriers to transit-oriented planning remain. Based on this analysis, the lack of a central urban core shouldn't be one of them.

Maui's Vacation Rental Debate Turns Ugly
Verbal attacks, misinformation campaigns and fistfights plague a high-stakes debate to convert thousands of vacation rentals into long-term housing.

Planetizen Federal Action Tracker
A weekly monitor of how Trump’s orders and actions are impacting planners and planning in America.

In Urban Planning, AI Prompting Could be the New Design Thinking
Creativity has long been key to great urban design. What if we see AI as our new creative partner?

Florida Seniors Face Rising Homelessness Risk
High housing costs are pushing more seniors, many of them on a fixed income, into homelessness.

Massachusetts Budget Helps Close MBTA Budget Gap
The budget signed by Gov. Maura Healey includes $470 million in MBTA funding for the next fiscal year.

Milwaukee Launches Vision Zero Plan
Seven years after the city signed its Complete Streets Policy, the city is doubling down on its efforts to eliminate traffic deaths.
Urban Design for Planners 1: Software Tools
This six-course series explores essential urban design concepts using open source software and equips planners with the tools they need to participate fully in the urban design process.
Planning for Universal Design
Learn the tools for implementing Universal Design in planning regulations.
Gallatin County Department of Planning & Community Development
Heyer Gruel & Associates PA
JM Goldson LLC
City of Camden Redevelopment Agency
City of Astoria
Transportation Research & Education Center (TREC) at Portland State University
Jefferson Parish Government
Camden Redevelopment Agency
City of Claremont