Politicians and planners be warned: you will now be judged according to your ability to improve walking, cycling and public transit services.
Politicians and planners be warned: you will now be judged according to your ability to improve walking, cycling and public transit services.
Last month I visited beautiful Melbourne, Australia to examine their transportation system and speak at various workshops. Severe commuter train crowding is considered the city's most urgent problem. The main newspaper recently demanded that the Public Transport Minister resign because of her failure to heed warnings of this problem. Similar dramas are playing out in most cities.
Travel demands are changing, and so should transportation planning priorities. It is time to shift resources from roadway to public transit investments in response. Expanding roads and parking facilities makes no sense when consumers really want better alternatives. Yet, our funding mechanisms continue to favor automobile-oriented improvements.
A few years ago my article, Changing Travel Demand: Implications for Transport Planning, published in the ITE Journal, predicted that automobile travel demand would stagnate while demand for alternative modes would increase due to various demographic and economic trends. These predictions are proving accurate. In recent years automobile travel has grown little or not at all (on a per capita basis it is negative) while transit ridership has increased dramatically. U.S. Transit travel increased more than automobile travel during seven of the last ten years and each of the last four years as illustrated in the table below. In total transit travel grew 24% compared with a 10% VMT increase during the last ten years.
U.S. Transit Ridership And Automobile Travel Trends
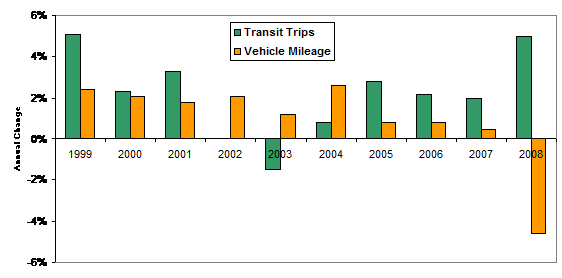
These shifts provide significant economic, social and environmental benefits. Automobile traffic reductions substantially reduce traffic congestion delays, traffic fatalities and fuel consumption. Unfortunately, transportation policies are slow to respond. Most public transit systems are now experiencing severe peak period crowding which discourages some potential transit users and perpetuates the impression that public transit is an uncomfortable and inferior form of transport.
This occurs because small reductions in vehicle traffic cause proportionately larger increases in public transit demand. Currently, about 98% of motorized travel is by automobile and 2% by public transit. When people reduce driving in response to incentives such as higher fuel prices or reduced incomes, 10-20% typically shifts to public transit, the rest consists of reduced or shorter automobile trips, and shifts to walking, cycling and ridesharing. Thus, a 5% reduction in automobile travel demand increases public transit demand by 25-50%.
Few public transit systems are prepared for such increases. This is a lost opportunity to solve traffic problems. Virtually everybody benefits from transit service improvements that attract travelers who would otherwise use an automobile.
Let's put this into perspective. The U.S. federal government is currently considering investing about $34 billion to support automobile manufactures to maintain about 200,000 jobs. According to the American Public Transportation Association's Transit Statistics 2008 report, capital investments in transit vehicles (both buses and trains) total about $3.8 billion annually and about 25 million commuters use public transit each workday. Thus, for about a tenth of the money being spent to support the automobile industry the federal government could double current transit vehicle funding which directly benefits ten times as many people and provides even larger indirect benefits.
Of course, these trade-offs are complex. The automobile industry bailout is supposed to be a one-time investment while transit system expansion will need to continue for decades. Many transit systems require facility improvements in addition to more vehicles, and increased service will require additional operating funds. On the other hand, increased ridership increases fare revenue and voter support for future public transit investments.
Critics often complain that public transit is inefficient and requires excessive subsidies, but their analysis often overlooks the important roles that transit plays in a modern transportation system. Although public transit carries only a small portion of total travel it serves particularly valuable and costly trips. It provides basic mobility (which requires service at times and places with low demand and special vehicles to accommodate people with disabilities) and commute travel on major urban corridors where accommodating additional automobile trips (including roadway, parking and vehicle costs) is particularly costly. In addition, high quality public transit is a catalyst for more accessible, multi-modal land use development patterns that leverage additional automobile travel reductions and so provide large indirect benefits.
High quality public transportation, such as in Boston, Chicago, Philadelphia, New York and San Francisco, requires about $200 annual per capita in additional public subsidy, but households living in these cities save more than $500 annually per capita in reduced transportation costs, and enjoy other benefits:
• A fifth lower per capita vehicle mileage.
• 30-50% lower per capita congestion costs.
• A third lower per-capita traffic fatality rates.
• A third lower transit operating costs.
• 58% higher transit service cost recovery.
• More money circulating in the local economy.
• More per capita walking.
• More efficient land use and higher property values.
• Improved environmental performance.
Shifting federal investments from automobile to transit industries is particularly beneficial because expanding the automobile industry contradicts other strategic development objectives: automobile manufacturing is a declining industry that increases transport system costs and inefficiencies, and increases fuel consumption and environmental impacts. In contrast, public transit expenditures create more domestic jobs per dollar (particularly if domestic vehicle manufactures can produce competitive buses and train cars), and help achieve various strategic planning objectives including congestion reduction, road and parking facility cost savings, increased consumer affordability, improved mobility for non-drivers, increased traffic safety, energy conservation, emission reductions, improved public fitness and health, and urban redevelopment.
What is your ideal mode split (portion of travel by various modes)? Overall, people spend an average of 60 to 80 minutes a day in travel. In automobile dependent areas, nearly all this time is spent driving, while in multi-modal communities a significant portion of travel is by walking, cycling and public transit, as illustrated in the graph below. As a result, residents of multi-modal communities tend to be healthier and wealthier than if they lived in more automobile-dependent areas.
Travel Mode Split – Portland Region (Lawton 2001)

Although few motorists want to give up automobile travel completely, many people would prefer to drive less and rely more on alternative modes, provided that they have quality facilities and services. Shifting resources from roads and parking facilities to improving walking and cycling conditions and public transit services is the way to provide the options people really want.
For more information
Edward Beimborn, and Robert Puentes (2003), Highways and Transit: Leveling the Playing Field in Federal Transportation Policy, Brookings Institute (www.brookings.edu).
DFT (2006), Transport Analysis Guidance, Integrated Transport Economics and Appraisal, Department for Transport (www.webtag.org.uk/index.htm).
ECONorthwest and PBQD (2002), Estimating the Benefits and Costs of Public Transit Projects, TCRP Report 78, TRB (www.trb.org); at http://gulliver.trb.org/publications/tcrp/tcrp78/index.htm.
David J. Forkenbrock and Glen E. Weisbrod (2001), Guidebook for Assessing the Social and Economic Effects of Transportation Projects, NCHRP Report 456, Transportation Research Board, National Academy Press (www.trb.org).
Keith T. Lawton (2001), The Urban Structure and Personal Travel: an Analysis of Portland, Oregon Data and Some National and International Data, E-Vision 2000 Conference (www.rand.org/scitech/stpi/Evision/Supplement/lawton.pdf).
Todd Litman (2005), Evaluating Public Transit Benefits and Costs, VTPI (www.vtpi.org); at www.vtpi.org/tranben.pdf.
Todd Litman (2009), Smart Transportation Economic Stimulation, VTPI (www.vtpi.org); at www.vtpi.org/econ_stim.pdf.
Robert Puentes (2008), The Road Less Traveled: An Analysis of Vehicle Miles Traveled Trends in the U.S., Brooking Institution (www.brookings.edu); at www.brookings.edu/reports/2008/1216_transportation_tomer_puentes.aspx?emc=lm&m=220694&l=17&v=39243.
TRL (2004), The Demand for Public Transit: A Practical Guide, Transportation Research Laboratory, Report TRL 593 (www.trl.co.uk); at www.demandforpublictransport.co.uk.

Planetizen Federal Action Tracker
A weekly monitor of how Trump’s orders and actions are impacting planners and planning in America.
Map: Where Senate Republicans Want to Sell Your Public Lands
For public land advocates, the Senate Republicans’ proposal to sell millions of acres of public land in the West is “the biggest fight of their careers.”
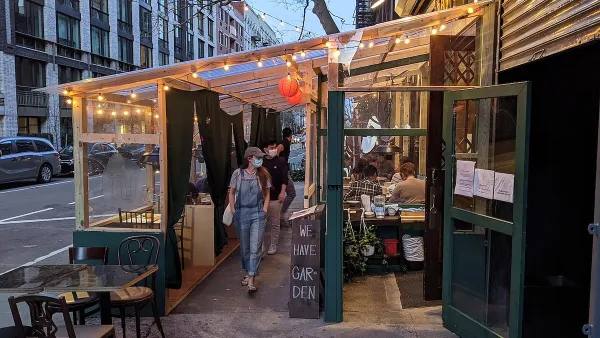
Restaurant Patios Were a Pandemic Win — Why Were They so Hard to Keep?
Social distancing requirements and changes in travel patterns prompted cities to pilot new uses for street and sidewalk space. Then it got complicated.

Platform Pilsner: Vancouver Transit Agency Releases... a Beer?
TransLink will receive a portion of every sale of the four-pack.

Toronto Weighs Cheaper Transit, Parking Hikes for Major Events
Special event rates would take effect during large festivals, sports games and concerts to ‘discourage driving, manage congestion and free up space for transit.”

Berlin to Consider Car-Free Zone Larger Than Manhattan
The area bound by the 22-mile Ringbahn would still allow 12 uses of a private automobile per year per person, and several other exemptions.
Urban Design for Planners 1: Software Tools
This six-course series explores essential urban design concepts using open source software and equips planners with the tools they need to participate fully in the urban design process.
Planning for Universal Design
Learn the tools for implementing Universal Design in planning regulations.
Heyer Gruel & Associates PA
JM Goldson LLC
Custer County Colorado
City of Camden Redevelopment Agency
City of Astoria
Transportation Research & Education Center (TREC) at Portland State University
Camden Redevelopment Agency
City of Claremont
Municipality of Princeton (NJ)


