A team of mathematicians have developed a model that demonstrates how traffic jams form.


"Many traffic jams leave drivers baffled as they finally reach the end of a tail-back to find no visible cause for their delay.
Now, a team of mathematicians from the Universities of Exeter, Bristol and Budapest, have found the answer and published their findings in leading academic journal Proceedings of the Royal Society.
The team developed a mathematical model to show the impact of unexpected events such as a lorry pulling out of its lane on a dual carriageway. Their model revealed that slowing down below a critical speed when reacting to such an event, a driver would force the car behind to slow down further and the next car back to reduce its speed further still.
The result of this is that several miles back, cars would finally grind to a halt, with drivers oblivious to the reason for their delay. The model predicts that this is a very typical scenario on a busy highway (above 15 vehicles per km). The jam moves backwards through the traffic creating a so-called ‘backward travelling wave', which drivers may encounter many miles upstream, several minutes after it was triggered. "
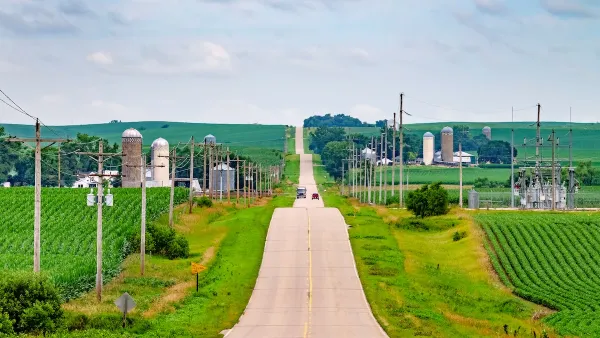
Thanks to Justin Emond
Read the full story: Traffic jam mystery solved by mathematicians

Planetizen Federal Action Tracker
A weekly monitor of how Trump’s orders and actions are impacting planners and planning in America.
Eastern Nebraska is running out of electricity
Data centers and electrification are straining eastern Nebraska’s grid, throttling economic development.
Study reveals best places in the U.S. for cycling, walking
New research from Streetlight Data examines bicycle and pedestrian miles per capita in the 100 largest U.S. cities by population.

DSA members accuse Mamdani of 'abandoning values' over housing redevelopment
New York City's mayor plans to replace about 2,000 units of public housing with private, mixed-income housing.

All sides of BRT debate unhappy with CDOT’s most recent move
The Colorado Department of Transportation is no longer considering center-running bus lanes for Colorado Boulevard.

Massachusetts bogs generate both power, and cranberries
Putting solar panels above farmland is one way Massachusetts is advancing toward its goal of net-zero carbon emissions by 2050.

FREE Course: Walkable City 1: Why Walkability?
After describing his path towards focusing on walkability as the essence of good planning, Jeff Speck marches through his five principal reasons for making more walkable places.
Reinventing Malls: Planning Alchemy—Turning Gray Fields Into Gold
The course focuses on the opportunities and imperatives that shape reinvention of mall sites.

City of Rosemead
Rutgers University, Edward J. Bloustein School of Planning and Public Policy
One Hundred Miles
University of Michigan School for Environment and Sustainability (SEAS)
Hunter College, City University of New York (CUNY)
The Architects Foundation
City of Cambridge
The Pocatello Development Authority
The Urban Renewal Agency of the City of Pocatello