A study of the Northeast Ohio economy provides a different way of analyzing and tracking the impact of economic development initiatives by mathematically analyzing economic data and determining there are eight key factors of regional economic growth.
Dashboard Indicators for the Northeast Ohio Economy, (57 pages) released by the Fund for Our Economic Future, establishes statistical correlations between economic growth in jobs, output, worker productivity and per capita income, and the eight key factors: Skilled workforce, urban assimilation, racial inclusion, legacy of place, income equality, locational amenities, business dynamics, and urbanization/metro structure.
The study demonstrates that when regional economies chart strong growth, they tend to score well in most or many of the eight categories, and when regional economies chart weak growth, they tend to score poorly in the eight categories. The study provides a different perspective than most indicator reports for measuring the impact of economic development activities. The press release accompanying the Dashboard Indicators release puts it this way:
"While other regions in the country have developed sets of factors to measure economic performance, frequently they are based on what seems interesting or useful. By contrast, The Dashboard Indicators for the Northeast Ohio Economy is based on statistical analysis, not on anyone’s agenda or preconceived ideas. The study allows public policy makers, business people, civic organizations and the general public for the first time to see beneath the surface of an economy and to understand the full range of factors figuring in a region’s economic performance. The study will be used to guide policy makers when developing targeted programs for addressing specific factors of the economy and to track the effect of such programming. For organizations working together toward economic development across the region, the Dashboard provides a common point of reference."
The study concludes there is no silver bullet for economic growth but that, nevertheless, some factors correlate more strongly with economic growth measures than others. For example:
"Perhaps the most interesting finding is that racial inclusion, income equality and ethnic diversity â€" measures of equity and fairness -- correlate positively to economic growth. These factors are not normally called out in regional economic measurement tools, but in this study they are shown to be important to the economic picture. Arguably, as we improve opportunity for all people, there is inherent economic benefit to the region as a whole," said Robert Jaquay, associate director of the George Gund Foundation and a member of the Fund for Our Economic Future's volunteer staff.
FULL STORY: Dashboard Indicators for Northeast Ohio Summary

Planetizen Federal Action Tracker
A weekly monitor of how Trump’s orders and actions are impacting planners and planning in America.

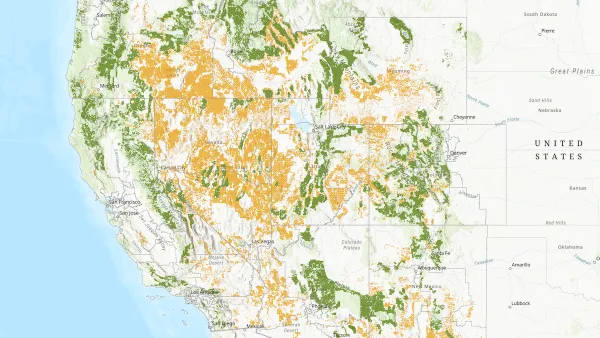
Map: Where Senate Republicans Want to Sell Your Public Lands
For public land advocates, the Senate Republicans’ proposal to sell millions of acres of public land in the West is “the biggest fight of their careers.”

Restaurant Patios Were a Pandemic Win — Why Were They so Hard to Keep?
Social distancing requirements and changes in travel patterns prompted cities to pilot new uses for street and sidewalk space. Then it got complicated.

Platform Pilsner: Vancouver Transit Agency Releases... a Beer?
TransLink will receive a portion of every sale of the four-pack.

Toronto Weighs Cheaper Transit, Parking Hikes for Major Events
Special event rates would take effect during large festivals, sports games and concerts to ‘discourage driving, manage congestion and free up space for transit.”

Berlin to Consider Car-Free Zone Larger Than Manhattan
The area bound by the 22-mile Ringbahn would still allow 12 uses of a private automobile per year per person, and several other exemptions.
Urban Design for Planners 1: Software Tools
This six-course series explores essential urban design concepts using open source software and equips planners with the tools they need to participate fully in the urban design process.
Planning for Universal Design
Learn the tools for implementing Universal Design in planning regulations.
Heyer Gruel & Associates PA
JM Goldson LLC
Custer County Colorado
City of Camden Redevelopment Agency
City of Astoria
Transportation Research & Education Center (TREC) at Portland State University
Camden Redevelopment Agency
City of Claremont
Municipality of Princeton (NJ)


