


Data storytelling refers to the ability to effectively communicate insights from data using narratives and visualizations. When done right, it can be used to put data insights into context and inspire action from decisionmakers.
There is no question that our world has become increasingly data-driven. While not everyone is involved in data collection, analysis, visualization, or storytelling, we are all becoming more dependent on data to guide, inform, and justify our work. Thus, we should embrace the use of data to advance our work in the same ways that we have grown accustomed to relying on data-driven devices like smartphones, fitness trackers, and global positioning system (GPS) navigation in our daily lives.
In this blog post, park planner Clement Lau explains the importance of data visualization and storytelling, with a focus on parks and recreation. For good examples of data visualization, he suggests that readers take a look at the National Recreation and Park Association (NRPA)’s Park Pulse Surveys and how the survey results are presented and summarized in infographics, charts, etc. Another example is how the Los Angeles County Department of Parks and Recreation (DPR) presents the key findings of its 2016 and 2022 Parks Needs Assessments in maps, graphs, and infographics in fact sheets, executive summaries, and final reports.
We often hear the expression that “numbers speak for themselves,” but this is not necessarily true. Lau points out that it really takes time, effort and skills to make sense of, present and communicate insights from data. For more information, please read the source article.
FULL STORY: The Importance of Data Visualization and Storytelling in Parks and Recreation


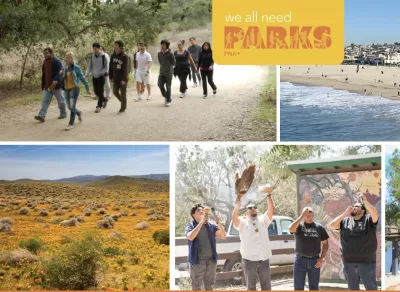
An App for California State Parks
California's Department of Parks and Recreation is getting into the app business. It is hoped that CaliParks will help improve access to the state's parks for young people and minorities.

Palmdale’s Beloved Water Park Gets $2 Million Upgrade
To mark its 20th anniversary, DryTown Water Park has undergone major renovations, ensuring that families across the Antelope Valley continue to enjoy safe, affordable, and much-needed water-based recreation in the high desert.

Irvine Ranked Second in Nation for Outstanding Park System
Irvine’s parks earned national recognition for their exceptional access, investment, and amenities, ranking second in the U.S. and first in California in the Trust for Public Land’s 2025 ParkScore Index.

Planetizen Federal Action Tracker
A weekly monitor of how Trump’s orders and actions are impacting planners and planning in America.

DARTSpace Platform Streamlines Dallas TOD Application Process
The Dallas transit agency hopes a shorter permitting timeline will boost transit-oriented development around rail stations.

Congressman Proposes Bill to Rename DC Metro “Trump Train”
The Make Autorail Great Again Act would withhold federal funding to the system until the Washington Metropolitan Area Transit Authority (WMATA), rebrands as the Washington Metropolitan Authority for Greater Access (WMAGA).

Supreme Court Ruling in Pipeline Case Guts Federal Environmental Law
The decision limits the scope of a federal law that mandates extensive environmental impact reviews of energy, infrastructure, and transportation projects.

Texas State Bills to Defund Dallas Transit Die
DART would have seen a 30% service cut, $230M annual losses had the bills survived.

Bikeshare for the Win: Team Pedals to London Cricket Match, Beats Rivals Stuck in Traffic
While their opponents sat in gridlock, England's national cricket team hopped Lime bikes, riding to a 3-0 victory.
Urban Design for Planners 1: Software Tools
This six-course series explores essential urban design concepts using open source software and equips planners with the tools they need to participate fully in the urban design process.
Planning for Universal Design
Learn the tools for implementing Universal Design in planning regulations.
Roanoke Valley-Alleghany Regional Commission
City of Mt Shasta
City of Camden Redevelopment Agency
City of Astoria
Transportation Research & Education Center (TREC) at Portland State University
US High Speed Rail Association
City of Camden Redevelopment Agency
Municipality of Princeton (NJ)