


The New York Times has published a spectacular mapping and data project to show the extent of flooding along the Mississippi River and its tributaries in the winter, spring, and summer of 2019.

Sarah Almukhtar, Blacki Migliozzi, John Schwartz, and Josh Williams are credited on the byline for an interactive feature that is a stunning piece of mapping and data reporting.
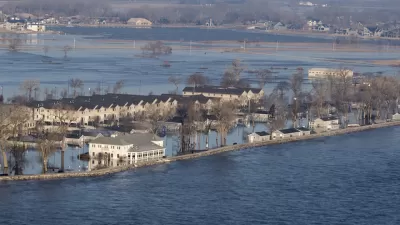
"The year's flooding across the Midwest and the South affected nearly 14 million people, yet the full scale of the slowly unfolding disaster has been difficult to fathom," according to the blurb that introduces the map. "To visualize just how extensive it was, The New York Times created this composite map showing all the areas that were inundated at some point from January to June."
Satellite data is used to show the extent of flooding compared to the usual edges of rivers. Farms that had to delay planting are also shown on the map, along with tags to document property destruction.
FULL STORY: The Great Flood of 2019: A Complete Picture of a Slow-Motion Disaster


Flooding in the Midwest Shows There's No Refuge From Climate Change
While projections say areas of the U.S. Midwest around the Great Lakes will become more hospitable as the climate changes, stormwater and flooding is still a challenge in a surprising number of locations.
Vital Lessons From the Midwest Bomb Cyclone and Flooding of 2019
The floodwaters still haven't subsided in parts of the Midwest, and lessons about climate change, extreme weather and proactive planning are badly needed to avoid similar catastrophes in the future.

A Toolbox of Green Infrastructure Solutions to Flooding Risks
A new one-stop shop for green infrastructure solutions is available to planners and engineers challenged by flooding.

Montreal Mall to Become 6,000 Housing Units
Place Versailles will be transformed into a mixed-use complex over the next 25 years.

Planetizen Federal Action Tracker
A weekly monitor of how Trump’s orders and actions are impacting planners and planning in America.

DARTSpace Platform Streamlines Dallas TOD Application Process
The Dallas transit agency hopes a shorter permitting timeline will boost transit-oriented development around rail stations.

Study: 4% of Truckers Lack a Valid Commercial License
Over 56% of inspected trucks had other violations.

Chicago Judge Orders Thousands of Accessible Ped Signals
Only 3% of the city's crossing signals are currently accessible to blind pedestrians.

Philadelphia Swaps Car Lanes for Bikeways in Unanimous Vote
The project will transform one of the handful of streets responsible for 80% of the city’s major crashes.
Urban Design for Planners 1: Software Tools
This six-course series explores essential urban design concepts using open source software and equips planners with the tools they need to participate fully in the urban design process.
Planning for Universal Design
Learn the tools for implementing Universal Design in planning regulations.
City of Mt Shasta
City of Camden Redevelopment Agency
City of Astoria
Transportation Research & Education Center (TREC) at Portland State University
US High Speed Rail Association
City of Camden Redevelopment Agency
Municipality of Princeton (NJ)