


The NACTO Bike Share and Micromobility Initiative yesterday published a bunch of data and infographics to explain the state of shared micromobility, defined as station-based bikeshare, dockless bike share, and scooter share.
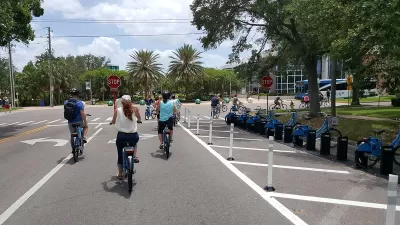
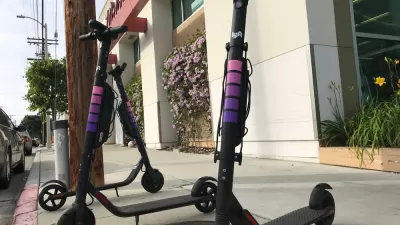
According to an analysis published by the NACTO Bike Share and Micromobility Initiative on April 17, 2019, people took 84 million trips on shared micromobility services in the United States in 2018, more than double the number of trips taken in 2017. Adding another layer of detail on the 2018 data, people took 36.5 million trips on station-based bike share systems and 38.5 million trips on shared e-scooters. Meanwhile dockless pedal (non-electric) bikes, "which quickly proliferated across the U.S. in 2017, have largely disappeared from North American cities, with just 3 million trips in a handful of cities in 2018,"" according to NACTO.
The report is mostly devoted to the kind of helpful infographics and maps that help illustrate all of this data. Explore the archive from the Planetizen Scooter Media Brief for more links to the details of how the proliferation of micromobility played out in 2018.
FULL STORY: Shared Micromobility in the U.S.: 2018

Lyft Pulls Micromobility From Los Angeles Area
The company will no longer provide shared bikes and scooters in the L.A. region, citing a ‘lack of longterm commitment’ from cities.

The State of the Micromobility Industry
The North American Bikeshare Association released the first-ever state of the industry report for active forms of micromobility—i.e., bike share and electric scooter rental companies.

An Atlas of E-Scooter Policies
Introducing the Micromobility Policy Atlas.

Maui's Vacation Rental Debate Turns Ugly
Verbal attacks, misinformation campaigns and fistfights plague a high-stakes debate to convert thousands of vacation rentals into long-term housing.

Planetizen Federal Action Tracker
A weekly monitor of how Trump’s orders and actions are impacting planners and planning in America.

In Urban Planning, AI Prompting Could be the New Design Thinking
Creativity has long been key to great urban design. What if we see AI as our new creative partner?

King County Supportive Housing Program Offers Hope for Unhoused Residents
The county is taking a ‘Housing First’ approach that prioritizes getting people into housing, then offering wraparound supportive services.

Researchers Use AI to Get Clearer Picture of US Housing
Analysts are using artificial intelligence to supercharge their research by allowing them to comb through data faster. Though these AI tools can be error prone, they save time and housing researchers are optimistic about the future.

Making Shared Micromobility More Inclusive
Cities and shared mobility system operators can do more to include people with disabilities in planning and operations, per a new report.
Urban Design for Planners 1: Software Tools
This six-course series explores essential urban design concepts using open source software and equips planners with the tools they need to participate fully in the urban design process.
Planning for Universal Design
Learn the tools for implementing Universal Design in planning regulations.
planning NEXT
Appalachian Highlands Housing Partners
Mpact (founded as Rail~Volution)
City of Camden Redevelopment Agency
City of Astoria
City of Portland
City of Laramie