


The new City Health Dashboard might be the first time many communities have had access to a treasure trove of public health data at the click of a mouse button.

Robin B. Schaz shares news of a new online "City Health Dashboard" that shares and illustrates public health data—both outcomes and drivers—for 500 U.S. cities.
"The City Health Dashboard, developed by NYU Langone Medical Center and the Robert F. Wagner School of Public Service at NYU, features both city- and neighborhood-level data," according to Schaz. Metrics are broken into categories for Social and Economic factors, Physical Environment, Health Behaviors, Health Outcomes, and Clinical Care. In addition to city-level and Census tract data, the platform also includes information on demographic groups.
"The health dashboard originally launched in January as a pilot in Flint, Mich.; Kansas City, Kan.; Providence, R.I.; and Waco, Texas, according to Schaz. "The tool has since expanded nationwide with a $3.4 million grant from the Robert Wood Johnson Foundation."
FULL STORY: New online tool shows how New Yorkers fare on health metrics


Harnessing Data for Community Development
Using data and insights encourages the development of a community, offering an evidence-based strategy to directly address the needs within.
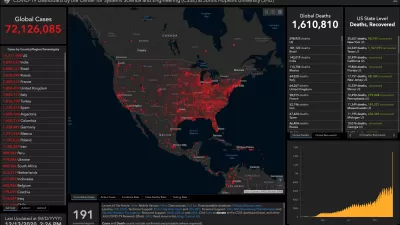
How Mapping Tools Played a Role in Understanding COVID-19
A new episode of the Geospatial Revolution Project assesses how scientists used digital mapping tools to think about the pandemic.

Pandemic Data for Planners
The right data will be critical in crafting effective responses to the threats posed by the coronavirus.

Maui's Vacation Rental Debate Turns Ugly
Verbal attacks, misinformation campaigns and fistfights plague a high-stakes debate to convert thousands of vacation rentals into long-term housing.

Planetizen Federal Action Tracker
A weekly monitor of how Trump’s orders and actions are impacting planners and planning in America.

San Francisco Suspends Traffic Calming Amidst Record Deaths
Citing “a challenging fiscal landscape,” the city will cease the program on the heels of 42 traffic deaths, including 24 pedestrians.

Defunct Pittsburgh Power Plant to Become Residential Tower
A decommissioned steam heat plant will be redeveloped into almost 100 affordable housing units.

Trump Prompts Restructuring of Transportation Research Board in “Unprecedented Overreach”
The TRB has eliminated more than half of its committees including those focused on climate, equity, and cities.

Amtrak Rolls Out New Orleans to Alabama “Mardi Gras” Train
The new service will operate morning and evening departures between Mobile and New Orleans.
Urban Design for Planners 1: Software Tools
This six-course series explores essential urban design concepts using open source software and equips planners with the tools they need to participate fully in the urban design process.
Planning for Universal Design
Learn the tools for implementing Universal Design in planning regulations.
Heyer Gruel & Associates PA
JM Goldson LLC
Custer County Colorado
City of Camden Redevelopment Agency
City of Astoria
Transportation Research & Education Center (TREC) at Portland State University
Jefferson Parish Government
Camden Redevelopment Agency
City of Claremont