


Planetizen's annual list of the most useful and innovative websites by and for planners (and every person interested in planning).
Every year, Planetizen provides a list of "Top Websites" to amplify the accomplishments of designers and developers who are expanding the power of the Internet to benefit of built and natural environments.
After collecting nominations from readers and staff, the Planetizen editorial staff selected the 2018 Top Websites list based on a common set of criteria, including content, design, and usability. This year, the list includes choosing 12 websites, representing a variety of uses and focuses. While these websites didn't necessarily launch this year, they represent the avant-garde of planning-related web technology in 2018.
What we see in 2018 are web products becoming so refined and powerful that they can simultaneously achieve high degrees of specialization as well as interactive tools that immediately expand the reach of every user. Websites that only do one thing are the exception now. The expectation is that websites are powerful, usable, and interactive.
The 2018 Top Websites are listed alphabetically below.
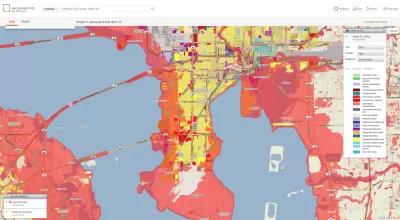
buildingeye
The first website on our list isn't a website as much as it’s a genre of websites enabled by one company's development savvy. The web development company buildingeye has helped cities like San Francisco, Pittsburgh, and Cupertino create mapping and visualization tools that simplify the presentation of permitting information to the public.
The advancements enabled buildingeye are so far beyond the previous generation of permit search websites it's almost sad to think how long the public has suffered such mediocrity. Each of the permit search sites for these municipalities resemble each other in ways that makes us hopeful that there might soon be a universal language for online data visualization portals. The advancements are not just about uniformity, however. Each city has the flexibility to customize the layers available on their sites. Pittsburgh has four layers of permitting information, for instance, while Cupertino has two.
Congress for the New Urbanism – Our Projects
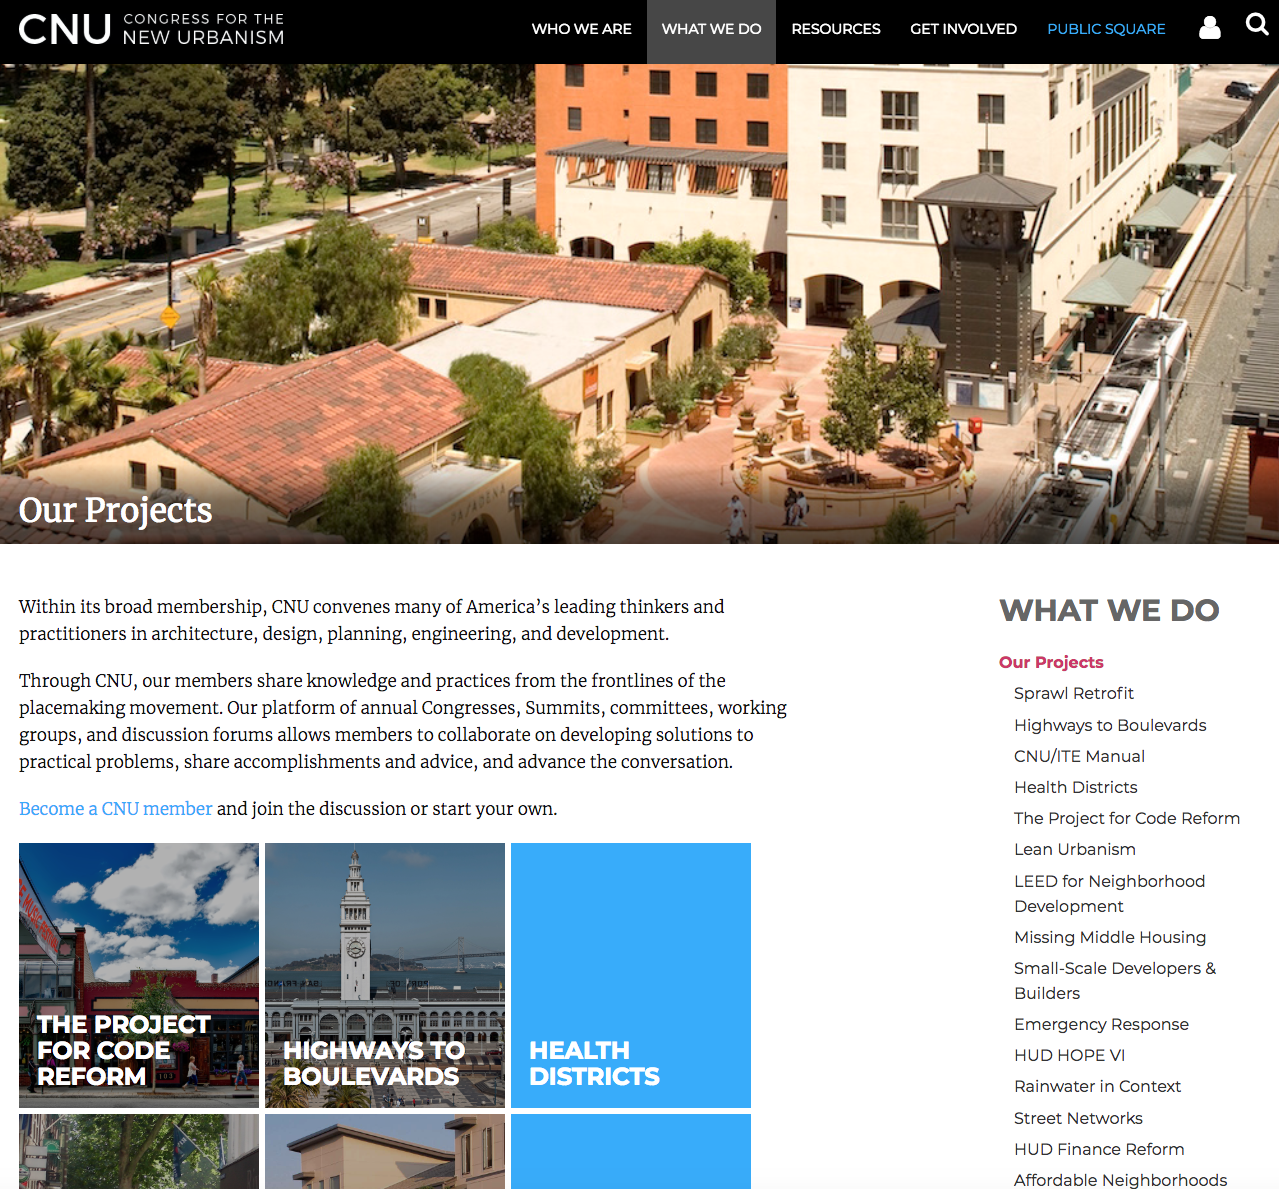
The most recent iteration of the Congress for the New Urbanism (CNU) website includes a new "Our Projects" portal that might be the advocacy organization's most successful attempt yet at capturing the ambition of its agenda.
CNU has a lot of ground to cover when it comes to imparting the scope of the organization's interest, and this website makes it easier than ever to cover it all and dive in. You might lose a few hours, or even days, exploring all there is to see and read here.
Curbed
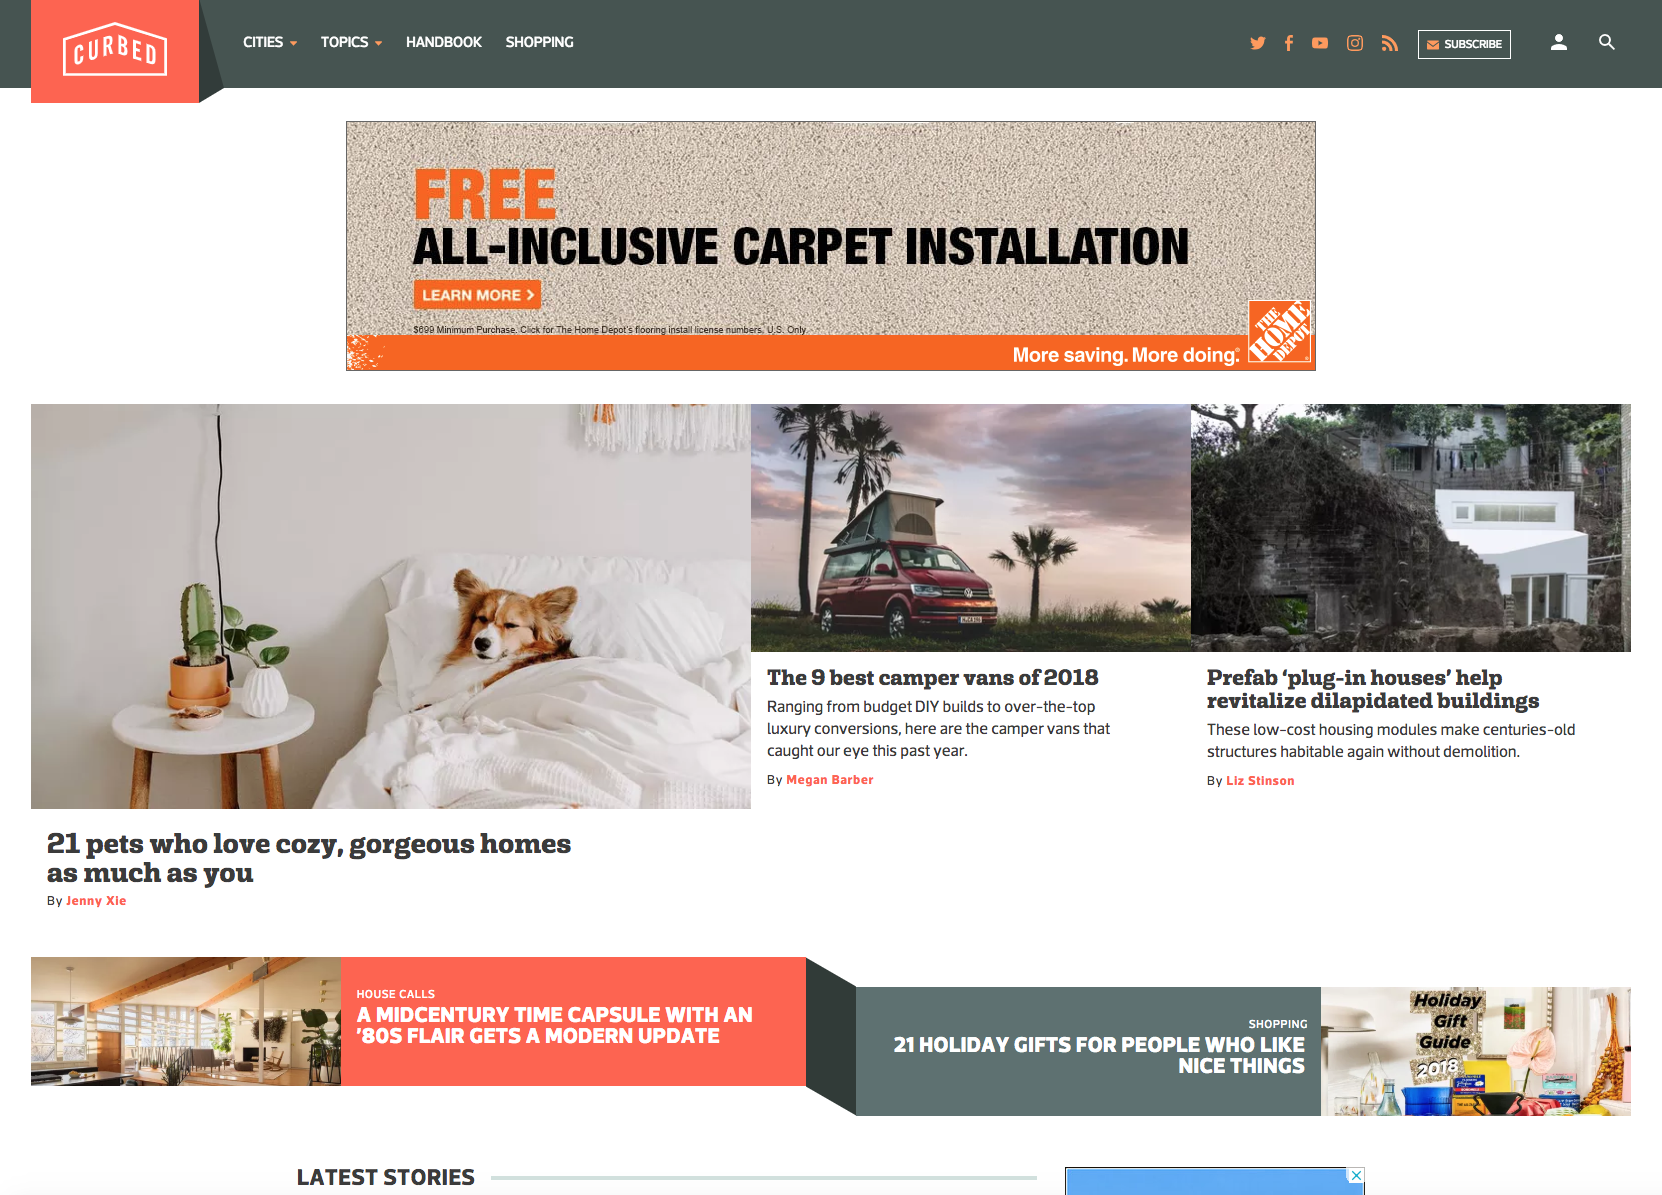
This year's recognition for planning news and commentary goes to Curbed. The website that redefined the news landscape for planning and design in the 21st century continues steady improvement that has persisted through ownership and leadership changes in recent years. National figures like Alissa Walker, Alexandra Lange, and Patrick Sisson provide a steady diet of highly informative and entertaining articles, while the site's local satellites continue to earn their rock star status in bringing public awareness to matters of the built and natural environments that might otherwise fail to find space in the local media's footprint. Curbed still drives the planning and urbanism discussion, just as it has for years.
Esri – Living Atlas
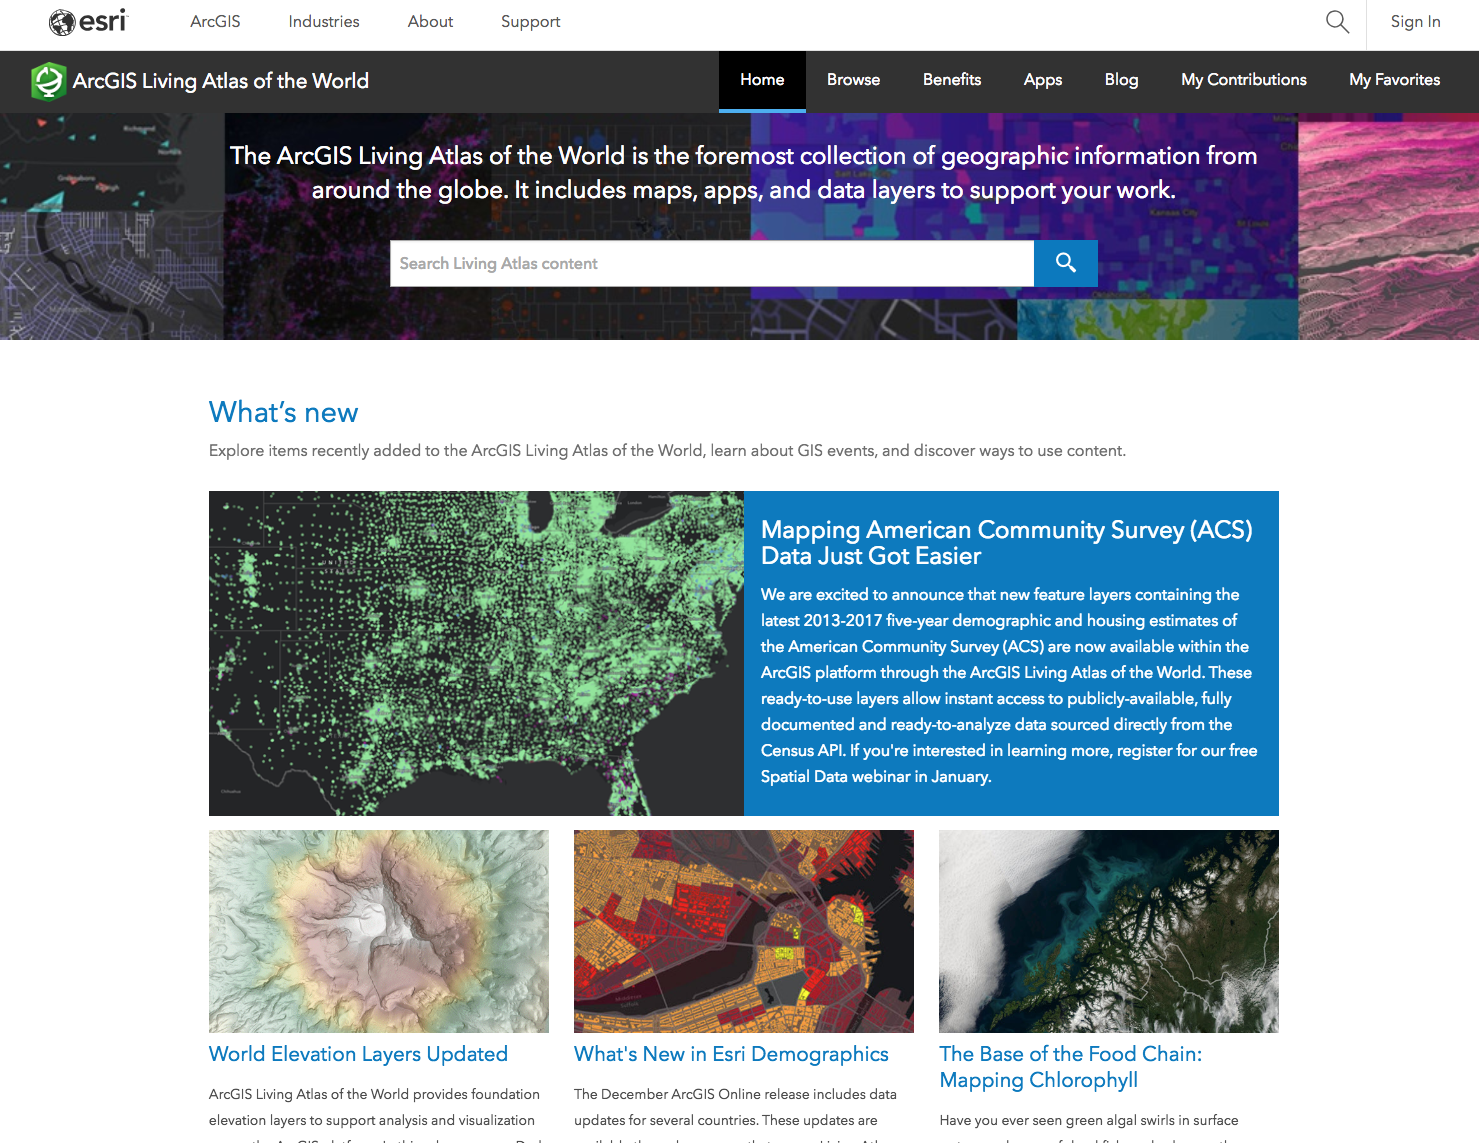
Esri, the world's leader in geographic information systems, works hard to fulfill a mission that reaches far beyond profit. The Living Atlas is a perfect example of that motivation. The presentation of the many online mapping and data tools found here tends to shift focus away from Esri to the products created by the people, companies, and governments with the help of Esri's products.
Curated content and interactive mapping tools present several methods for accessing best practices, training, and data. For instance, Esri presents an entire portal of the Living Atlas to public policy maps. The desired outcome: an empowered public, making more informed choices. It's hard to find another company so intently focused on real-world outcomes.
Google Insights Explorer
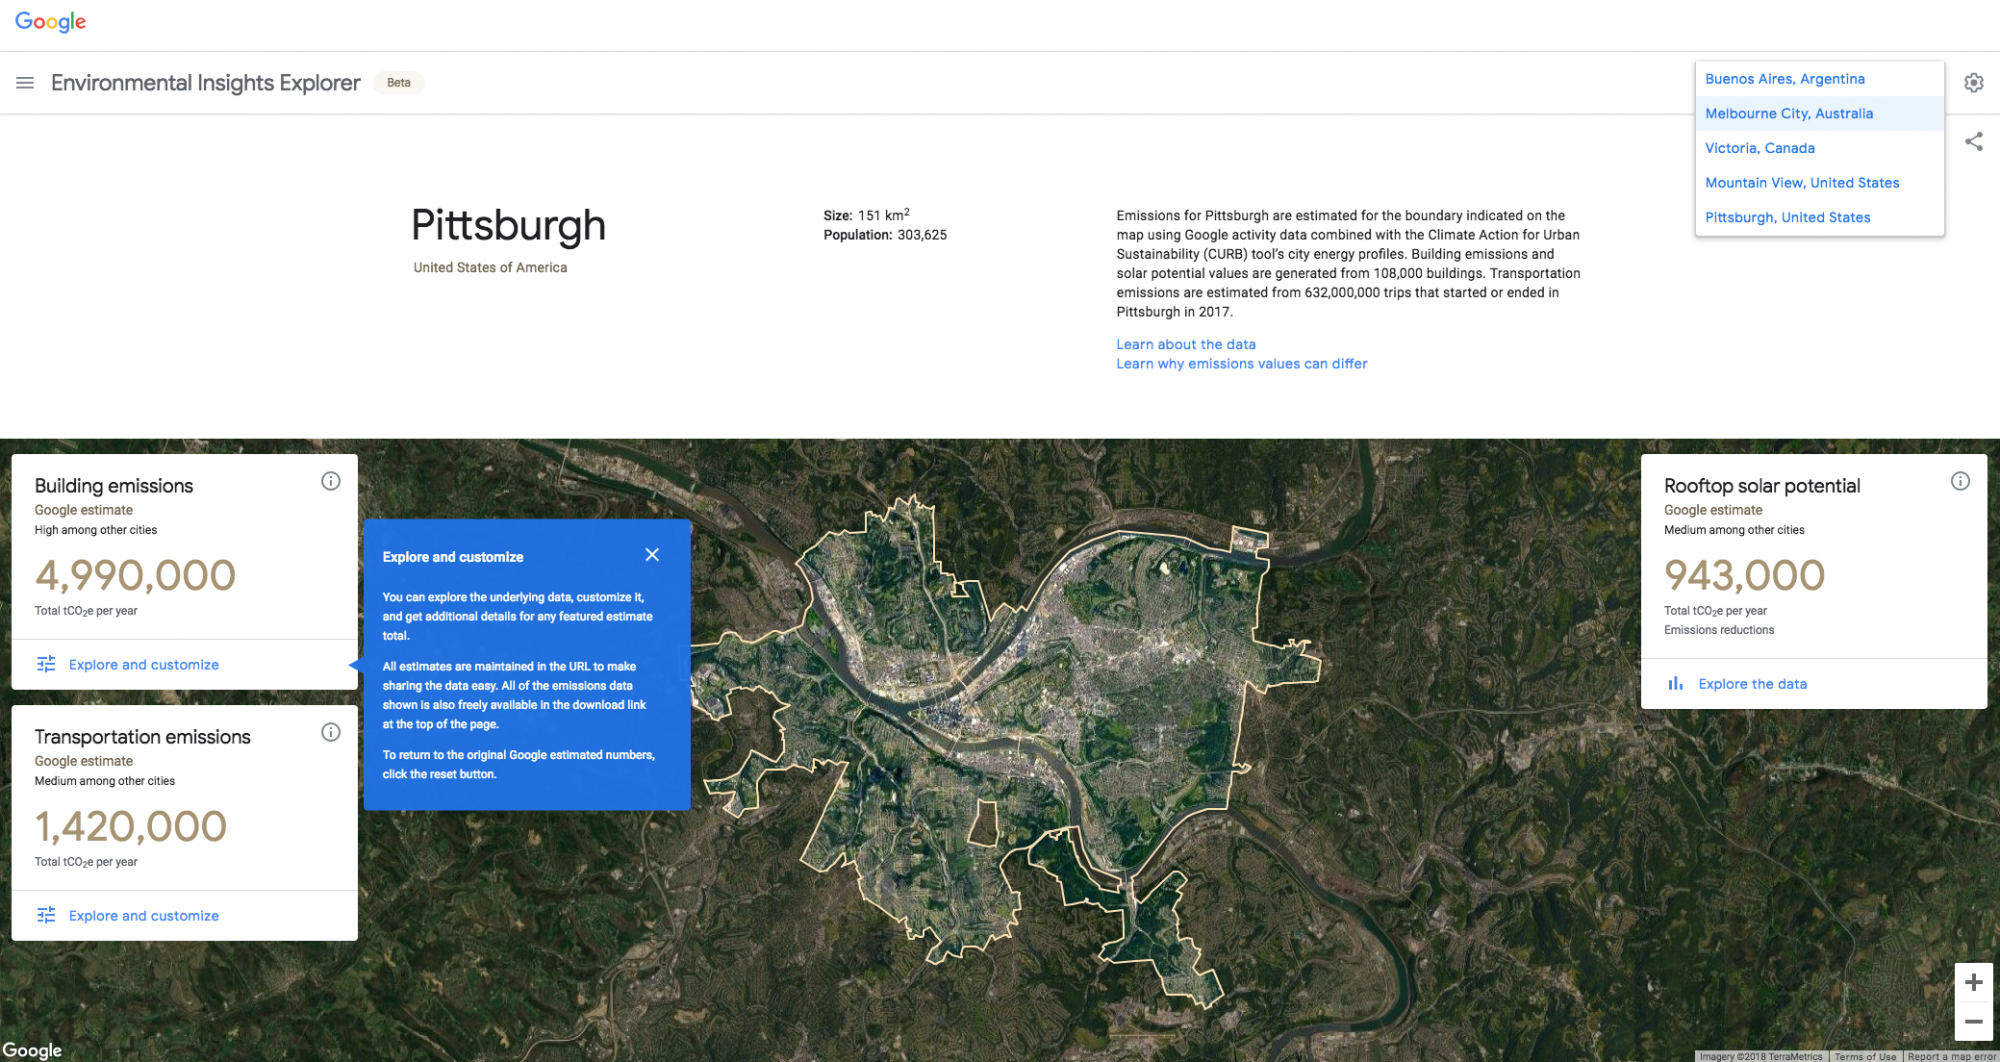
Earlier this year, Google released a new mapping tool that maps a few select cities' carbon footprints. So far the tool is available for analysis of carbon emissions in Buenos Aires, Melbourne, Victoria (Canada), Mountain View, and Pittsburgh. The users can explore and customize data on building emissions and transportation emissions. The map also presents data on the rooftop solar potential of each city. Also included on the website are additional resources for transforming this information into action.
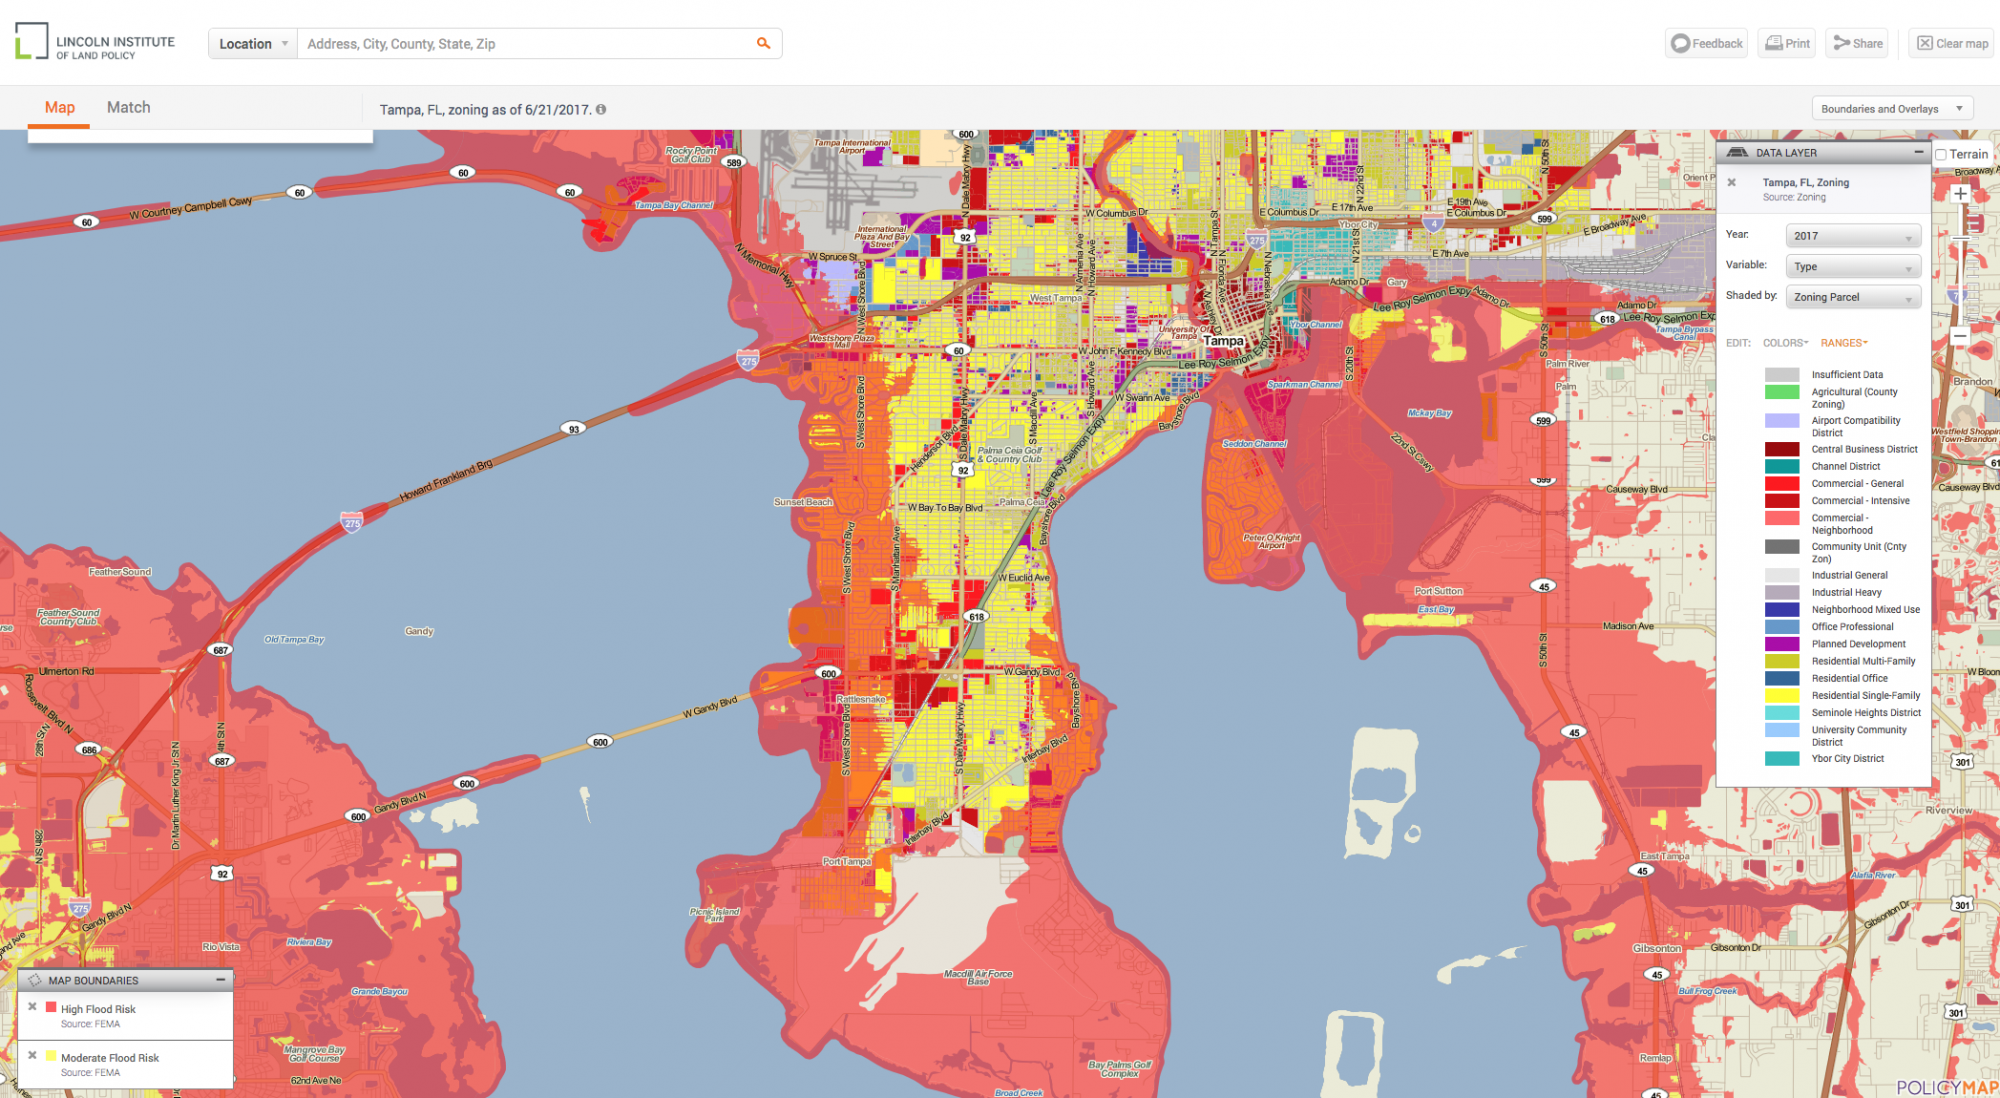
Lincoln Institute of Land Policy – The Place Database
Using a PolicyMap platform, the Lincoln Institute's Place Database grounds the evolving and emerging constellation of publicly available datasets in the most useful of all visualization tools: a map. Most datasets include several years of data, and datasets and maps are available from the whole spectrum of geographic scales. Zoning maps for 105 cities and fiscal information for 150 cities are also included. The website also includes a few use studies to showcase the power of the tool, such as a map that layers flood risk (sourced from FEMA) with zoning designations in Tampa, Florida.
NYC Planning Labs
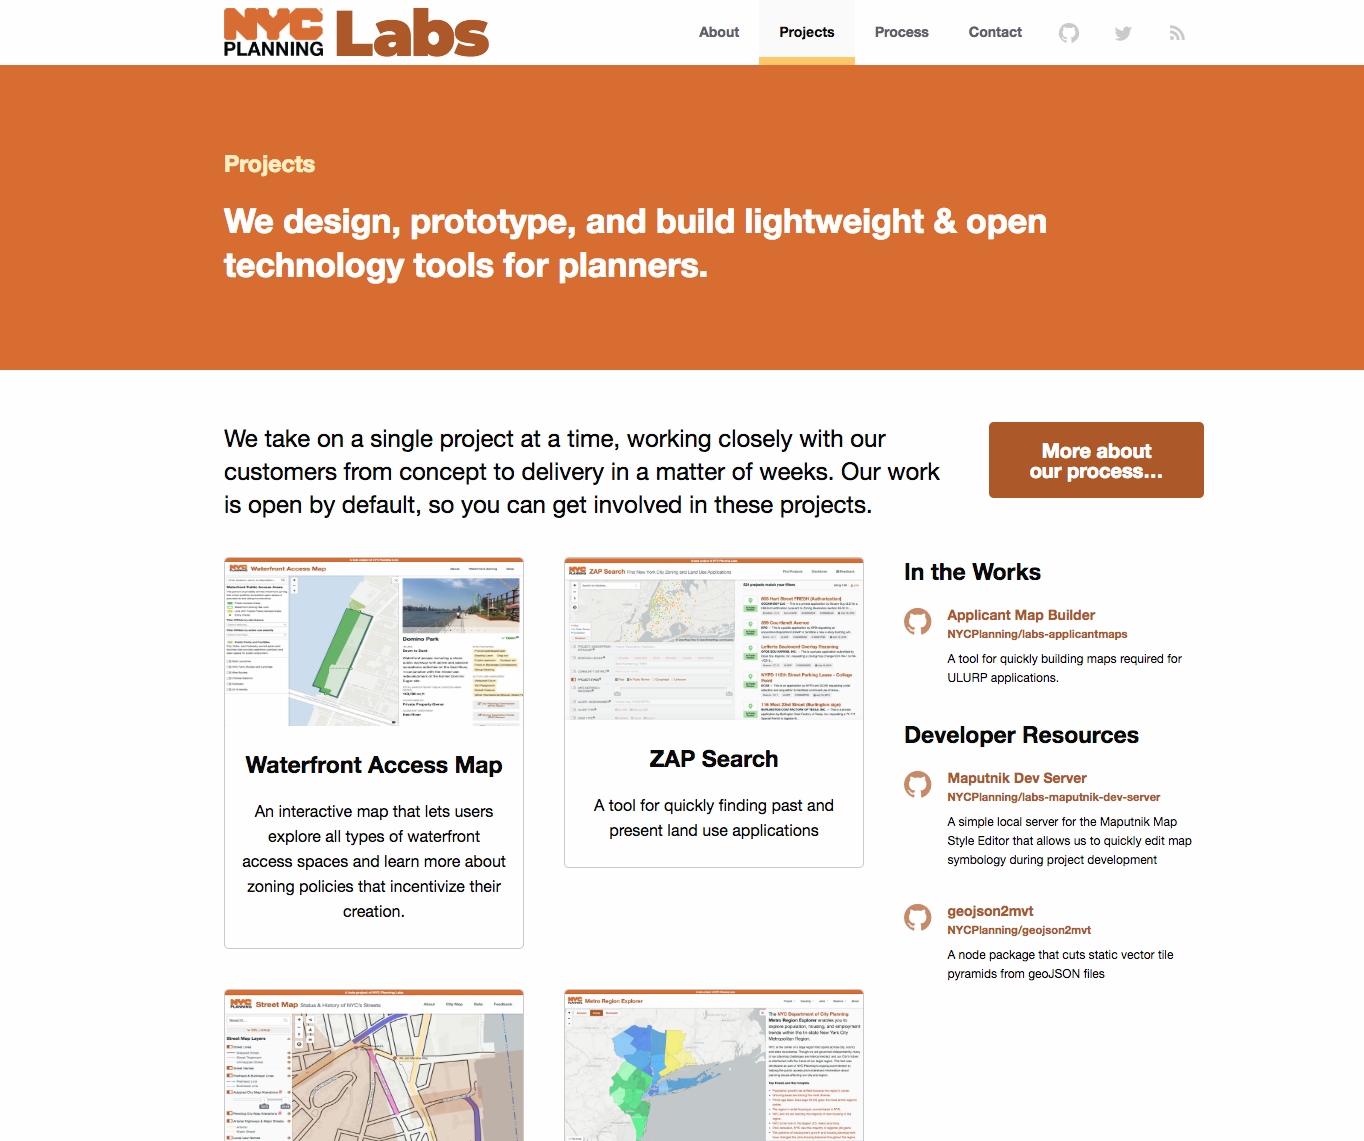
Planning Labs is a division of the New York City Department of City Planning, working to build open source web tools "with, not for" urban planners in New York City and beyond. NYC Planning Labs is modeled on the example of 18F within the General Services Administration at the federal level. The open ethos and work ethic of NYC Planning is also apparent in a steady stream of blog posts and product deliveries. Every city should be so lucky as to have a team of developers in house producing useful web tools like these.
NYU Furman Center – CoreData.nyc
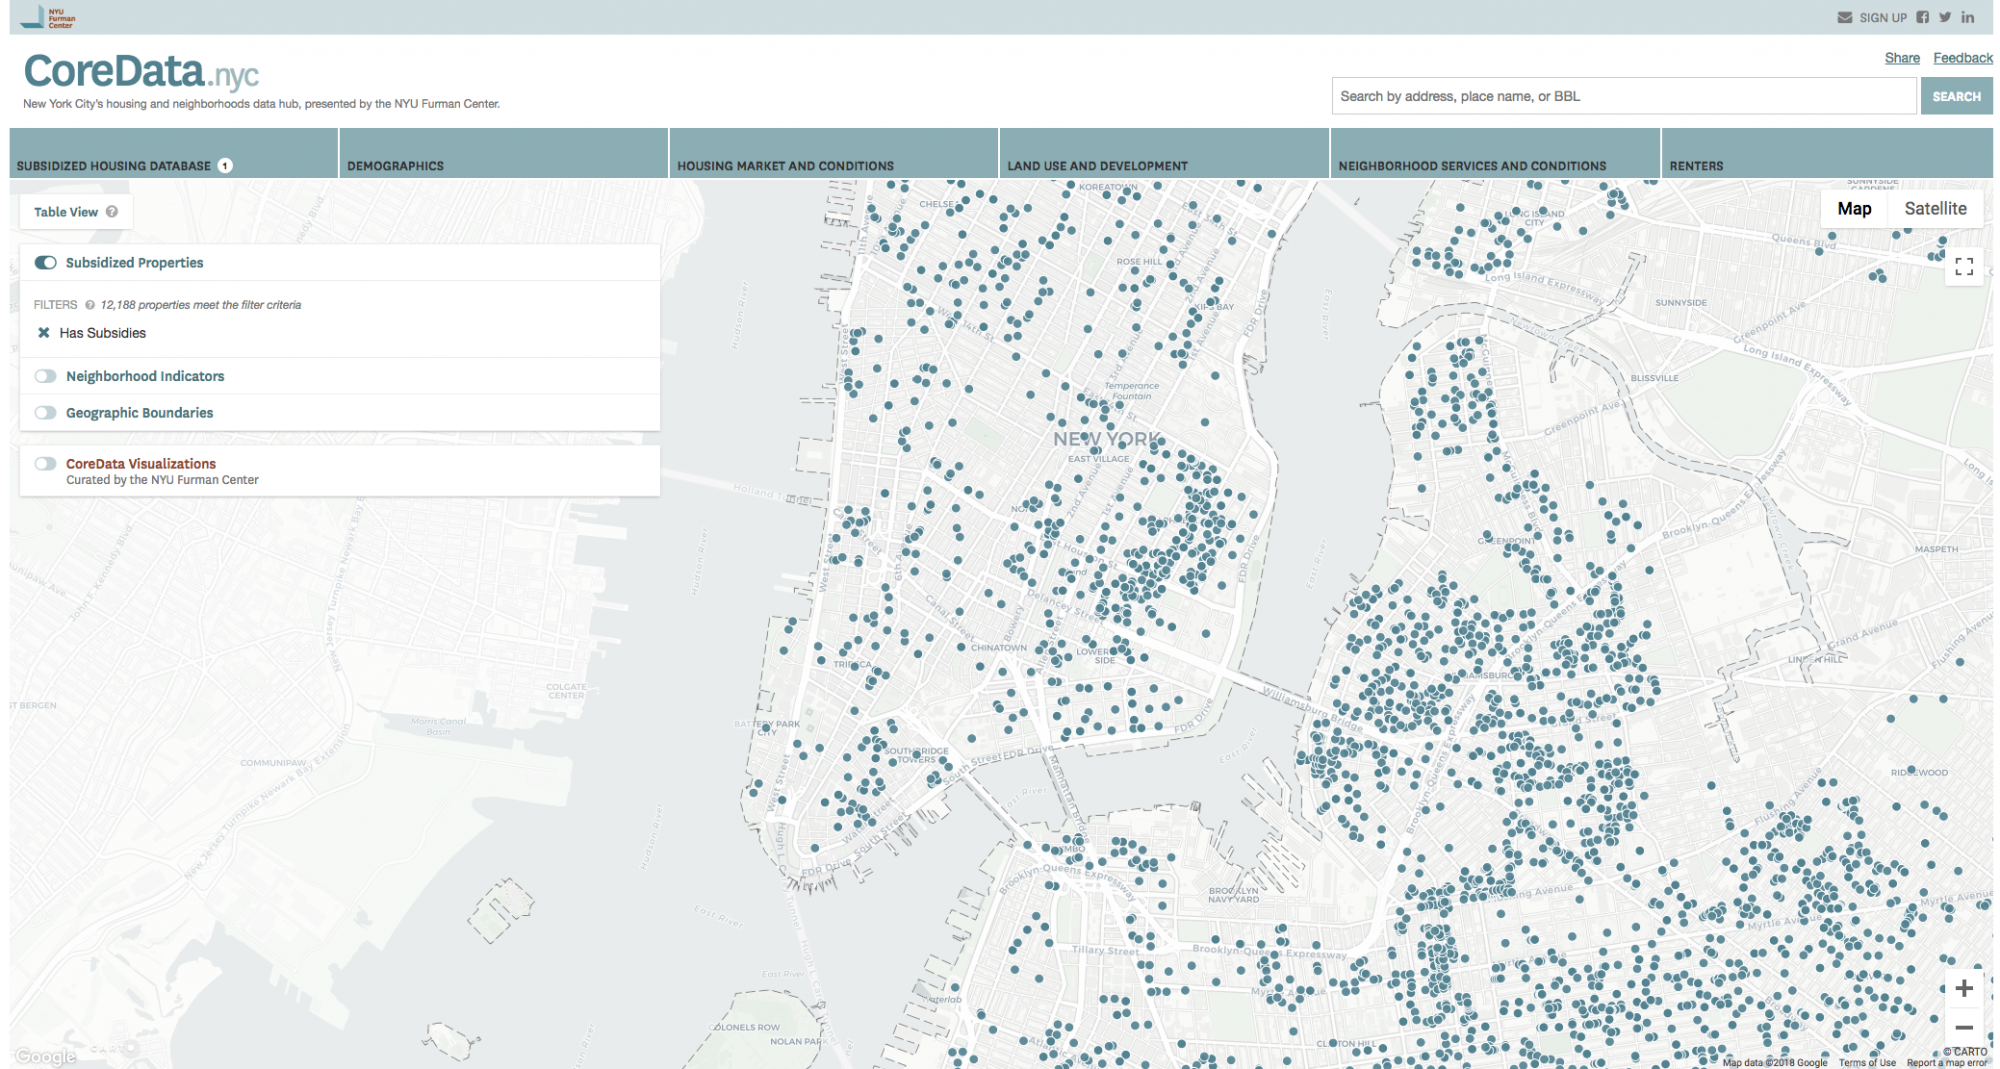
NYU Furman Center has created a data hub for information about housing and neighborhoods in New York City that should be the envy of localities everywhere. Simple clicks through categories of subsidized housing, demographics, housing market, land use and development, neighborhood services, and renters produce maps that reveal the character of New York City layer by layer.
Portland – Central City in Motion Plan Project Website
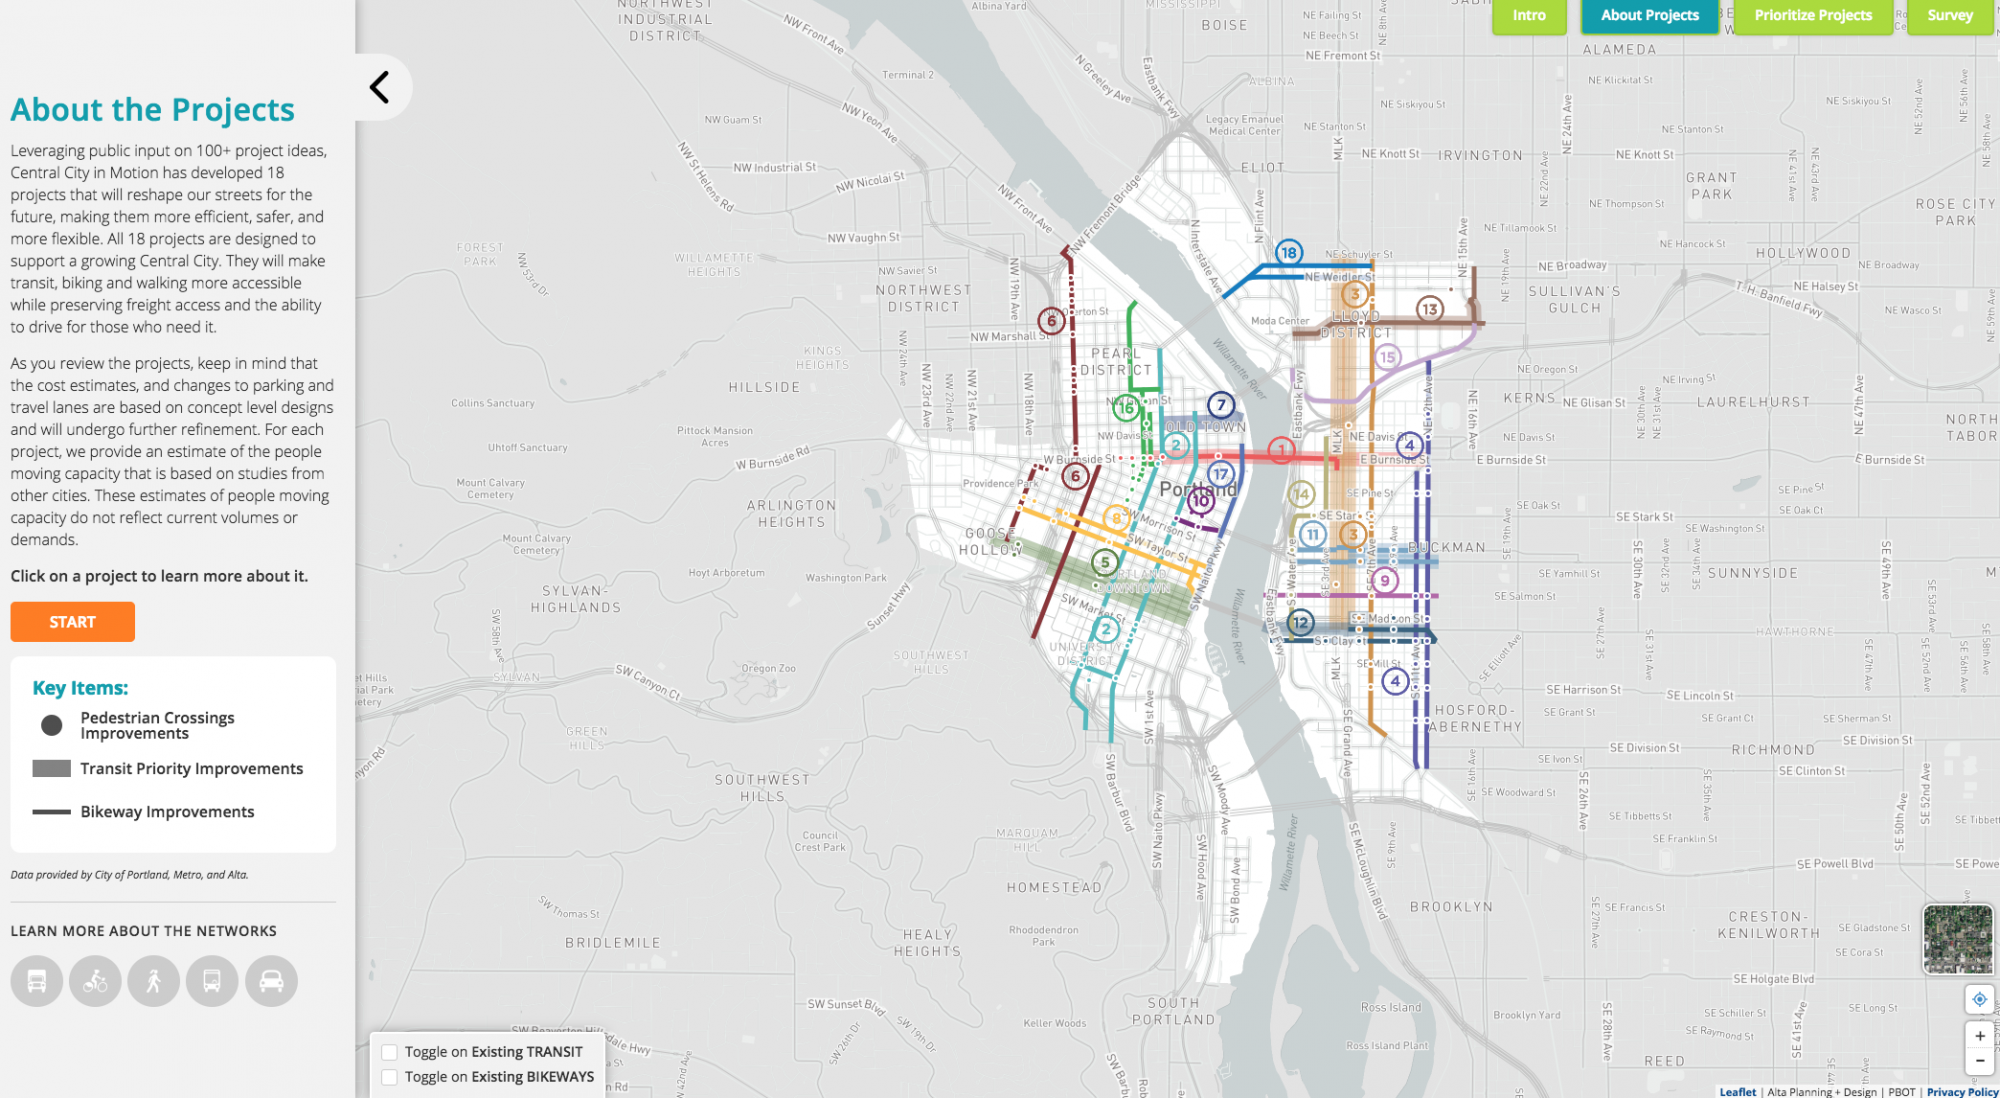
Portland's Central City in Motion plan was one of the most ambitious and progressive planning processes on 2018, and the website for the project reflects that ambition. The site uses the Leaflet open-source JavaScript library to build interactive maps that illustrate the changes proposed by the plan. Earlier in the process, residents could take a survey to rank priorities from a list of projects—a survey tool at the forefront of community engagement and public feedback innovation. Throughout the website, contemporary website design and seamless user experience also set this website apart as the finest example of planning websites in the country.
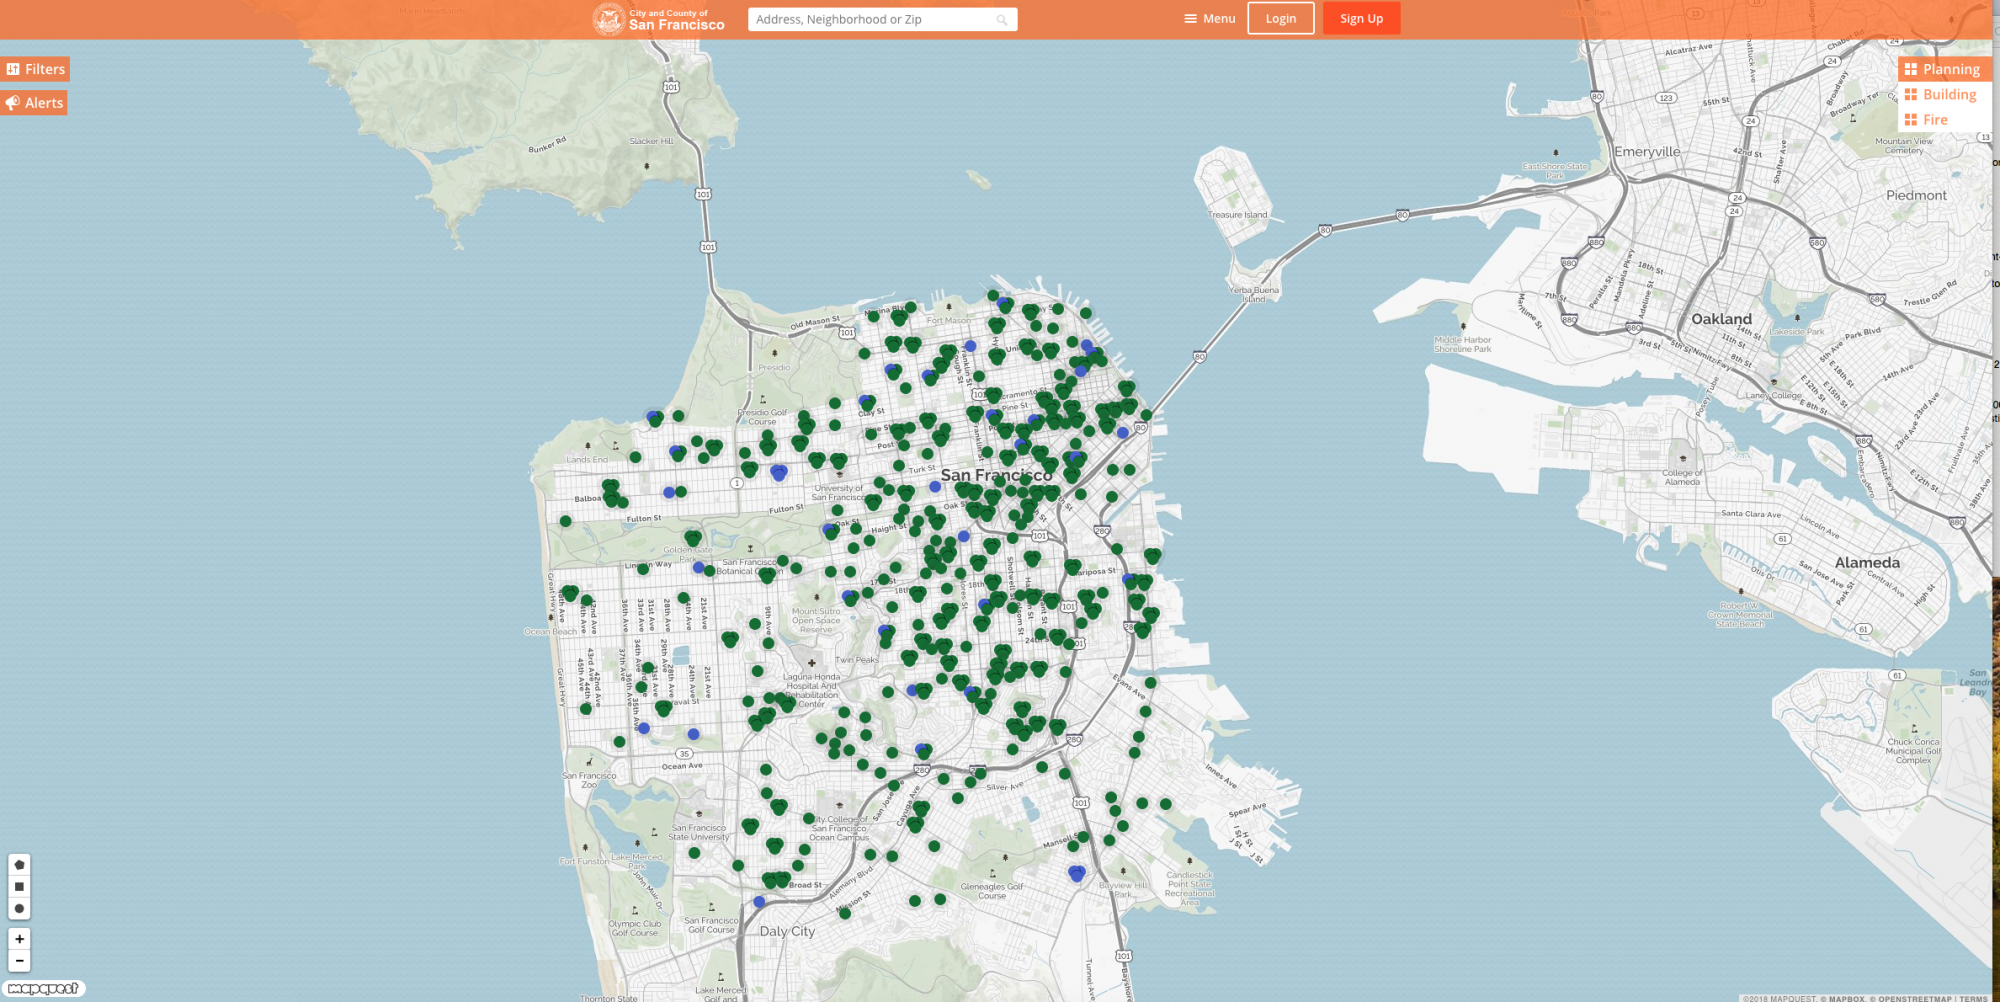
San Francisco – DataSF
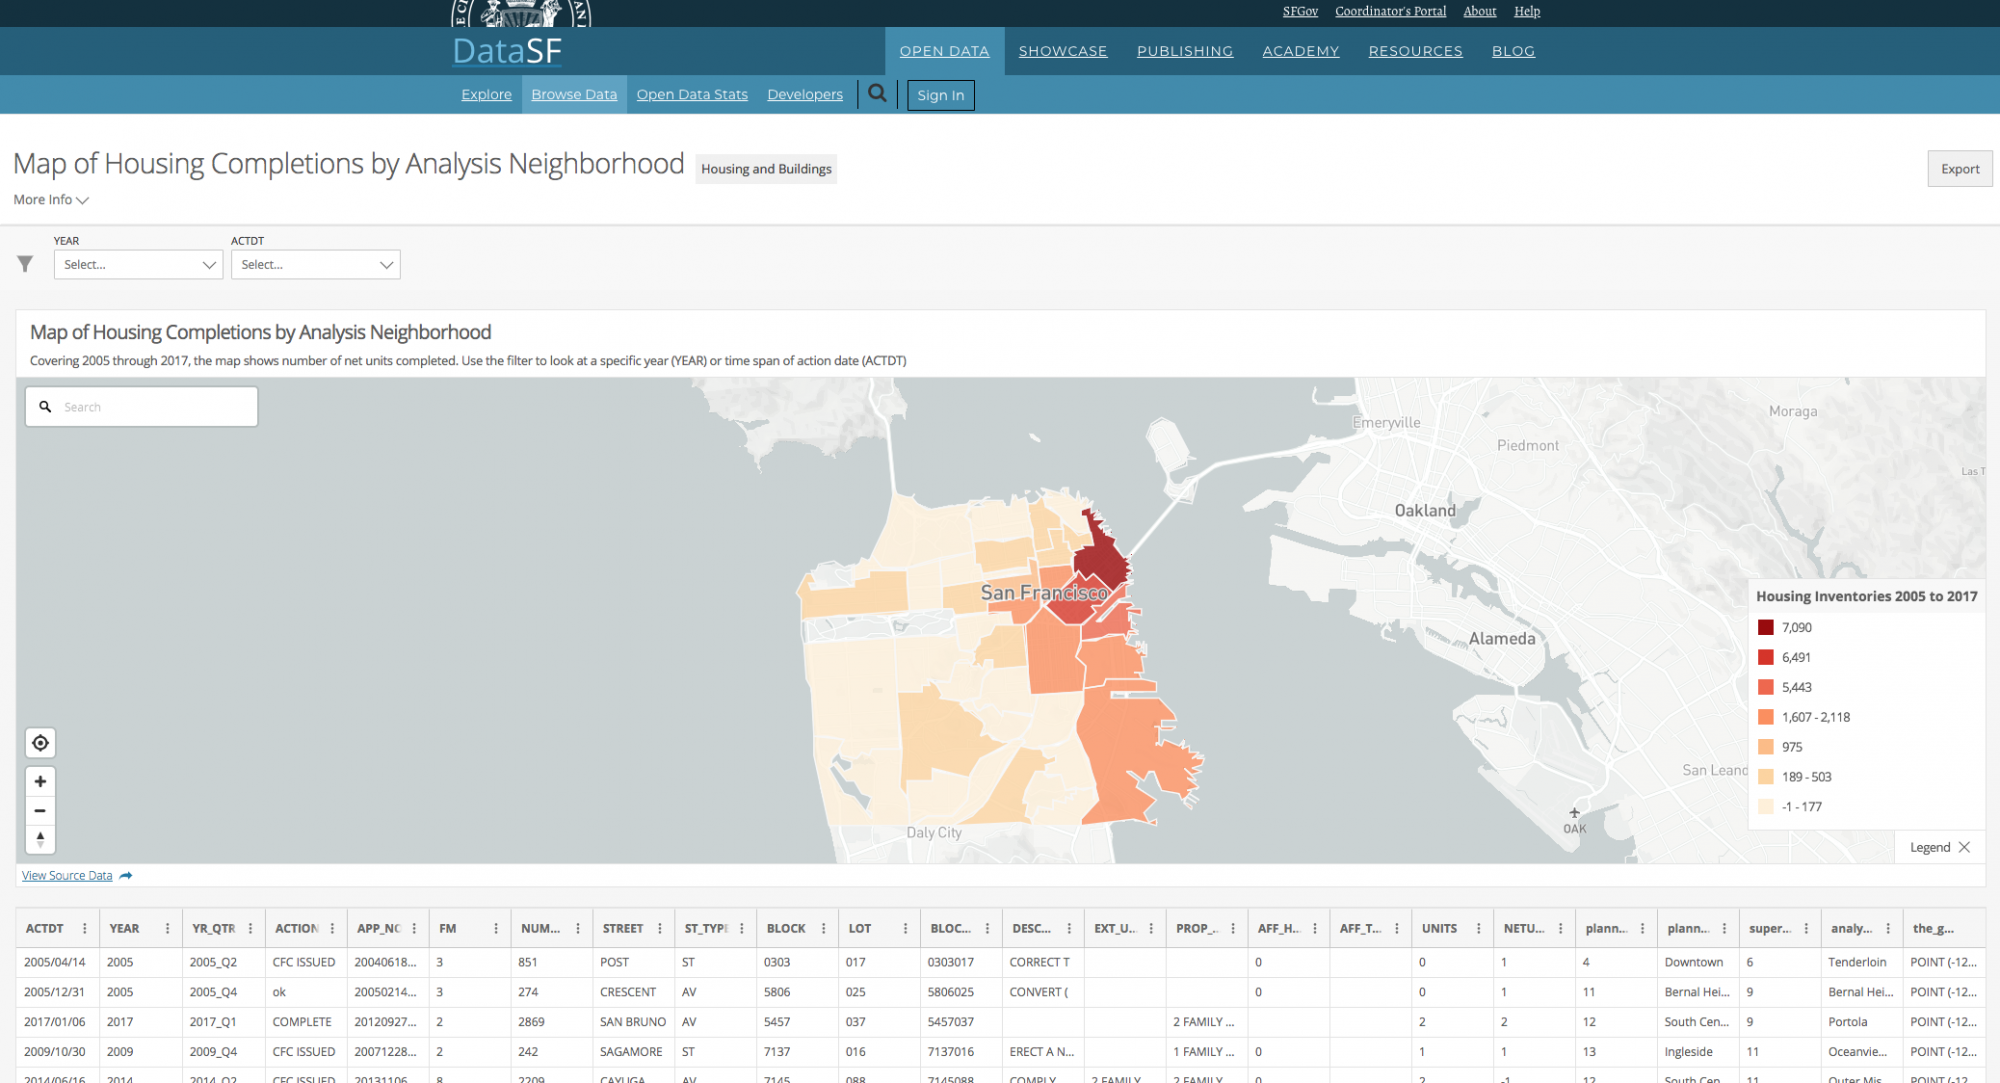
Driven by Socrata's open data tools, DataSF releases a steady stream of data tools in the name of open data and governance. Where DataSF goes the extra mile, however, is in presenting interactive maps and data science case studies. The site’s map of housing inventory data from 2005 and 2017, for instance, empowers anyone who takes the time to look for it with exact and authoritative information on one of the most controversial challenges facing any city, anywhere. The San Francisco Building Explorer is a prototype application based on data from DataSF.
Seattle Streets Illustrated
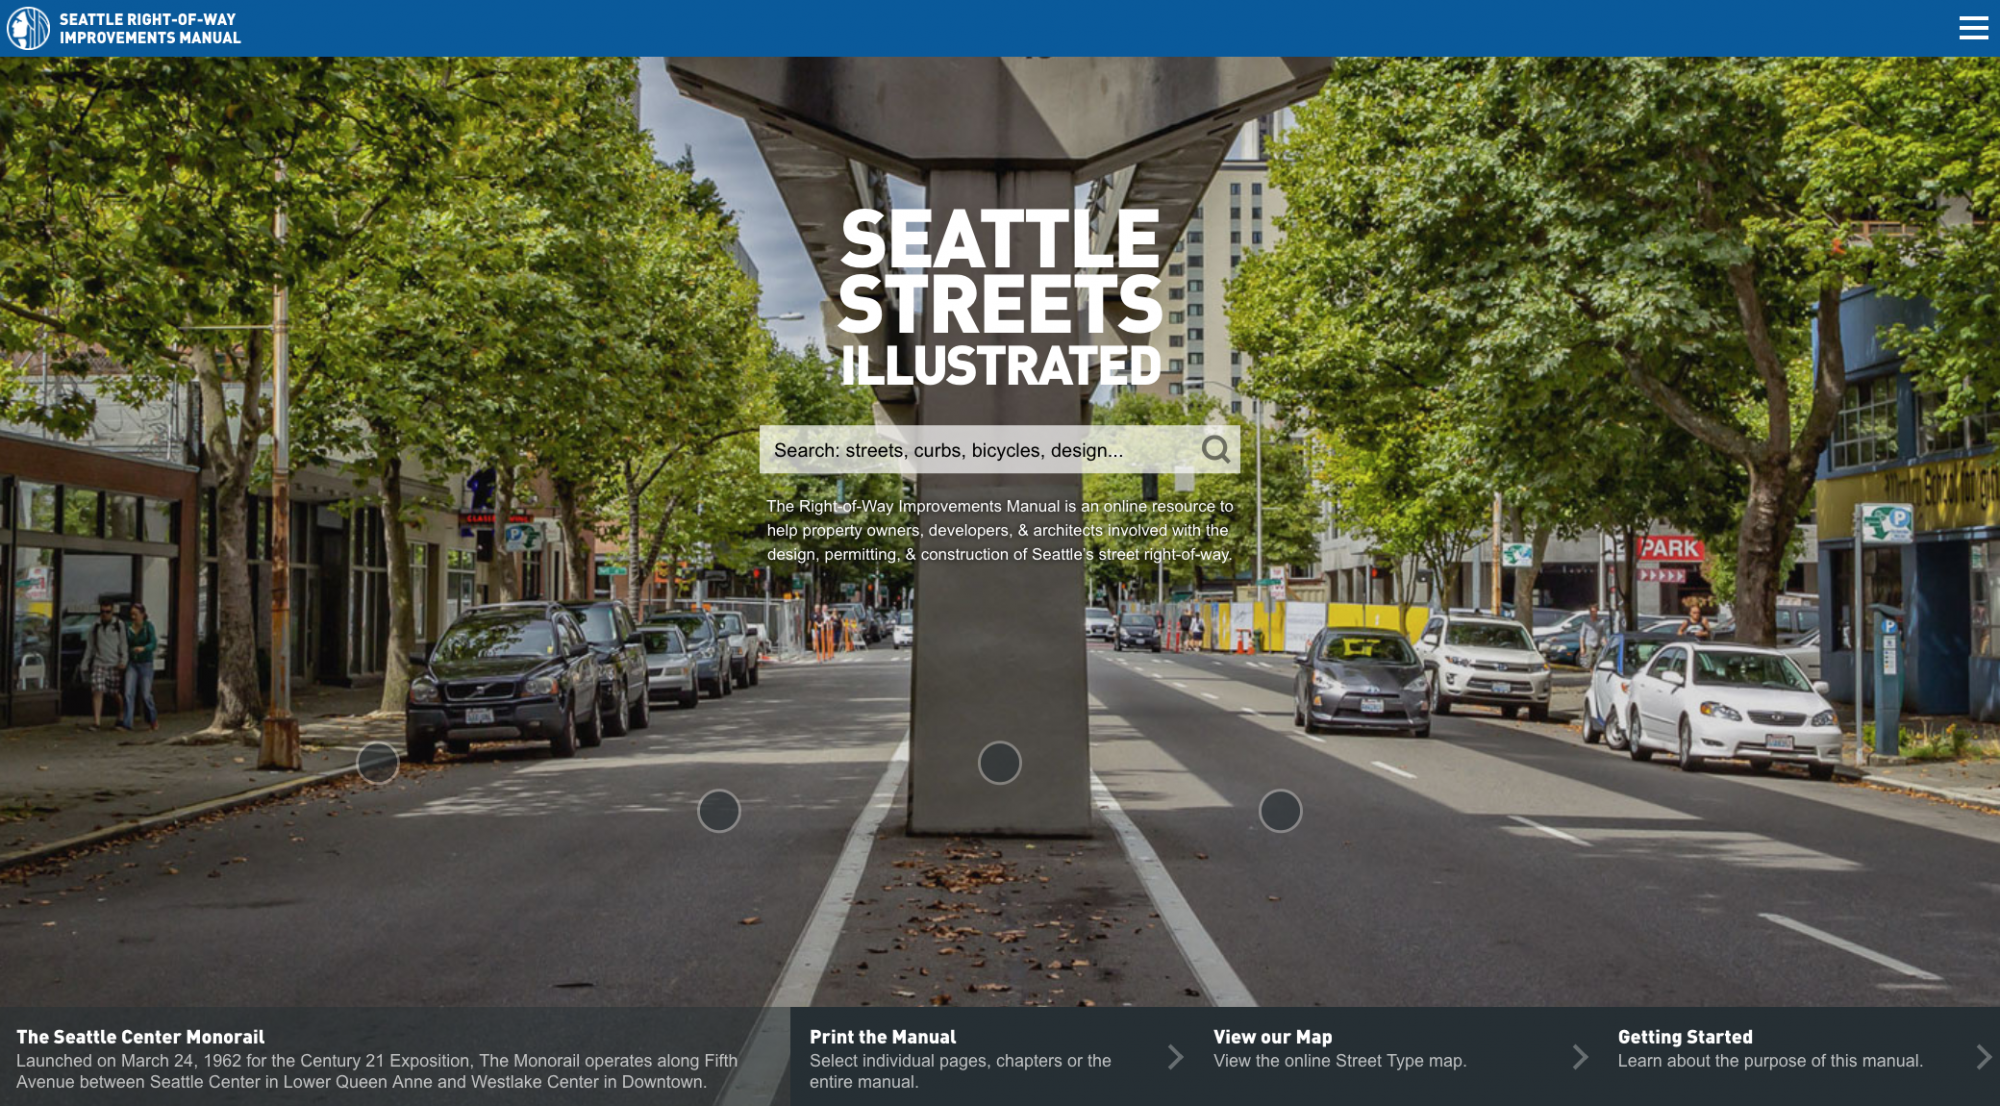
Seattle Street Illustrated pulled off a feat that will make citizens of all kinds stand and cheer: Instead of relegating its new streets manual to a pdf—the low-bar standard accepted by municipalities all over the country and the world—the city of Seattle created a lightweight, highly searchable and accessible website. Even the name of the website, Seattle Streets Illustrated, shows off the benefits of web technology when offering this kind of critical policy content online. The full name of the manual is far more prosaic: the Seattle Right-of-Way Improvements Manual.
Tableau
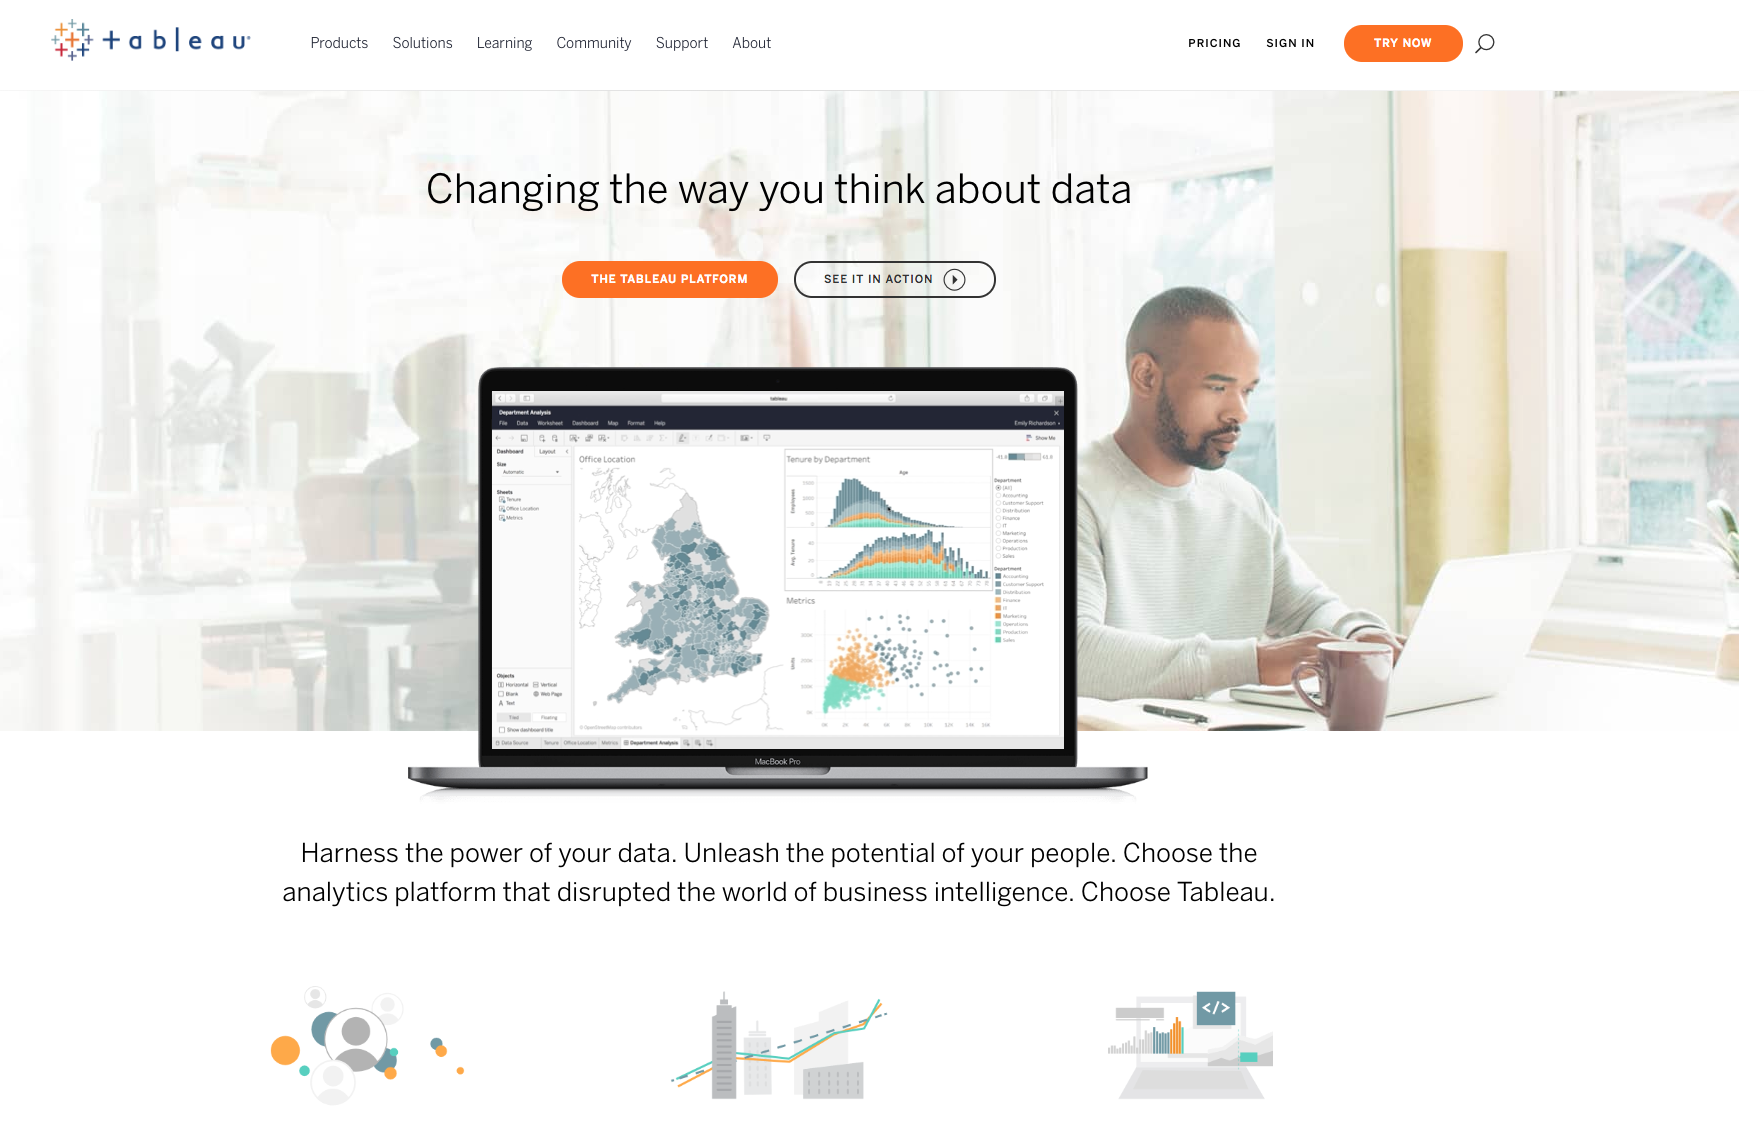
Tableau is a desktop app that enables a new era of shareable content, offering free tools for creating visualizations and then publishing online. The price tag (free for the basic version) and its usability (extremely intuitive) make Tableau the harbinger of a new era of data visualization software.


Top Websites for Urban Planning - 2022
Every year, Planetizen collects the websites breaking new digital ground in the world of planning and related fields.

New Interactive Mapping Tool Tracks all of NYC's Infrastructure Projects, Housing Permits, and City Facilities
The New York Department of City Planning has taken its open data practices to a new level with the launch of the Capital Planning Explorer.
Top Websites for Urban Planning – 2021
Planetizen's annual list of the best of the urban planning Internet.

Maui's Vacation Rental Debate Turns Ugly
Verbal attacks, misinformation campaigns and fistfights plague a high-stakes debate to convert thousands of vacation rentals into long-term housing.

Planetizen Federal Action Tracker
A weekly monitor of how Trump’s orders and actions are impacting planners and planning in America.

Chicago’s Ghost Rails
Just beneath the surface of the modern city lie the remnants of its expansive early 20th-century streetcar system.

Bend, Oregon Zoning Reforms Prioritize Small-Scale Housing
The city altered its zoning code to allow multi-family housing and eliminated parking mandates citywide.

Amtrak Cutting Jobs, Funding to High-Speed Rail
The agency plans to cut 10 percent of its workforce and has confirmed it will not fund new high-speed rail projects.

LA Denies Basic Services to Unhoused Residents
The city has repeatedly failed to respond to requests for trash pickup at encampment sites, and eliminated a program that provided mobile showers and toilets.
Urban Design for Planners 1: Software Tools
This six-course series explores essential urban design concepts using open source software and equips planners with the tools they need to participate fully in the urban design process.
Planning for Universal Design
Learn the tools for implementing Universal Design in planning regulations.
planning NEXT
Appalachian Highlands Housing Partners
Mpact (founded as Rail~Volution)
City of Camden Redevelopment Agency
City of Astoria
City of Portland
City of Laramie