Did test scores in progressive cities drop more post-COVID than test scores in conservative ones?



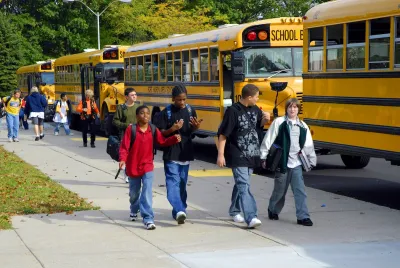
In 2023, I blogged about “Learning Loss and Urban Schools” and concluded that even though test scores in urban schools declined during the COVID era (2020-22), this decline seemed to be no worse in urban schools than suburban schools.
After examining more recent data, I became curious about something else: have post-COVID learning losses been greater in more leftish urban school districts than in centrist urban school districts?
Quantifying learning loss
There is a data source with information about the largest individual school districts: The Nation’s Report Card, a website containing data from the National Assessment of Educational Progress (NAEP), a set of national assessments carried out by the U.S. Education Department’s National Center for Education Statistics. Although most NAEP data is national or statewide, the website also has test score information for about twenty-five large school districts.
To start off with, I had to find a way of dividing these districts into more progressive districts and more centrist districts. I relied on Google AI, which (as I would have suspected) placed the most heavily Democratic districts in inelastic cities (high-density cities that have annexed little or no suburban land) in the “progressive” category. This group included Chicago, New York, Washington, Boston, Los Angeles, Philadelphia, Baltimore, Milwaukee, Cleveland and Detroit. In addition, Google AI placed several school district containing elastic cities (low-density cities with lots of suburban territory) in the “progressive” category, including San Diego, Denver, Austin and Albuquerque. AI’s choice of Austin made intuitive sense to me because of its progressive reputation, while San Diego, Denver and Albuquerque might be more leftish than other districts containing elastic cities because of Democratic domination of those states’ executive branches.
According to Google AI, the more conservative school districts with NAEP data for both 2019 (the last pre-COVID year with test data) and 2024 (the last year with school district data) are Miami-Dade, Hillsborough County (Tampa and its suburbs), Charlotte, Guilford County (Greensboro, North Carolina and its suburbs), Atlanta, Louisville, Clark County (Las Vegas and its suburbs), Jacksonville (Florida), Houston, Dallas and Fort Worth. Most of these districts include suburbs and/or highly elastic cities, and thus made intuitive sense to me except Atlanta (which perhaps was placed in the “centrist/conservative” category because Republicans dominate Georgia state government).
Then, I needed to find a way of measuring learning loss in these districts. I focused on the Nation’s Report Card test data on eighth-grade* and math and reading scores between 2019 and 2024.
Reading scores in progressive, centrist districts decline
For the 10 inelastic cities mentioned above, these were the trends in average reading scores:
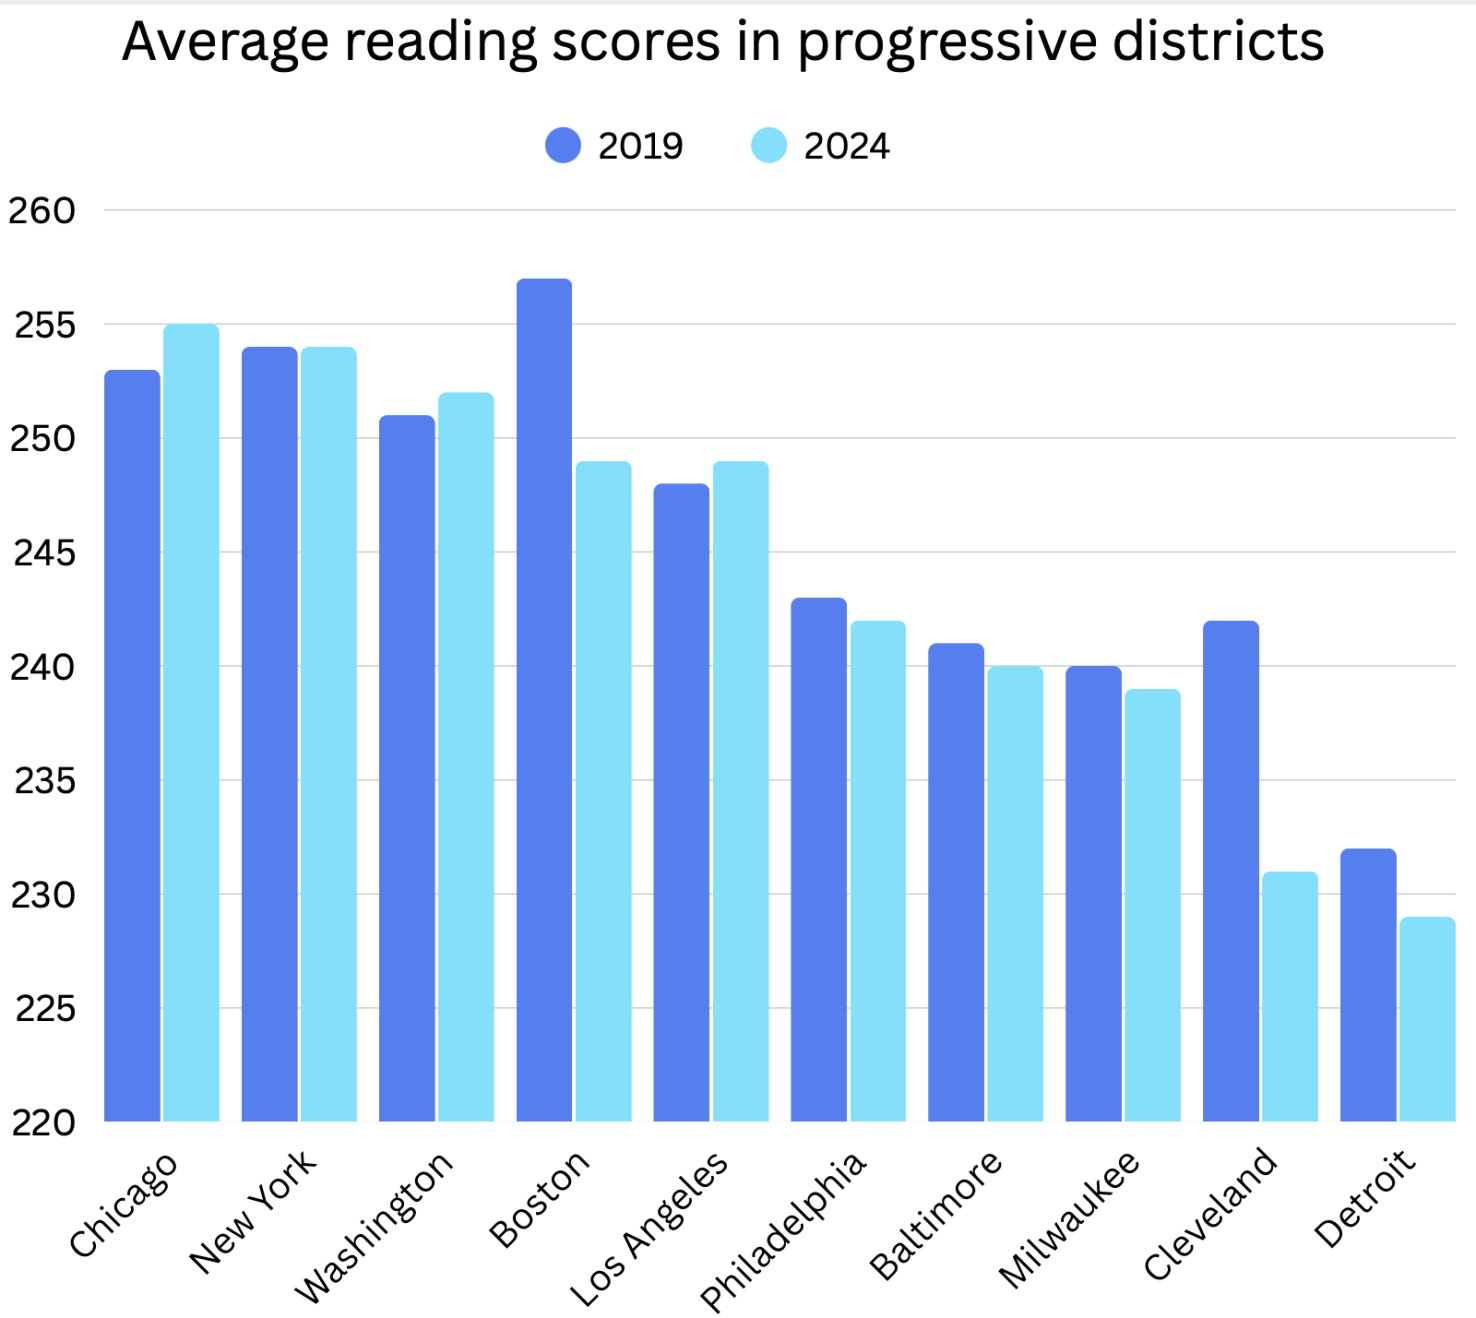
The average school district in this group lost 2.1 points, lower than the national 5-point decline during this period (from 263 to 258). To put it another way, most progressive districts had almost no change in reading scores or below-average declines, but two districts (Cleveland and Boston) had abnormal declines.
What about the four “kinda-sorta-progressive districts” (Austin, San Diego, Denver and Albuquerque)?
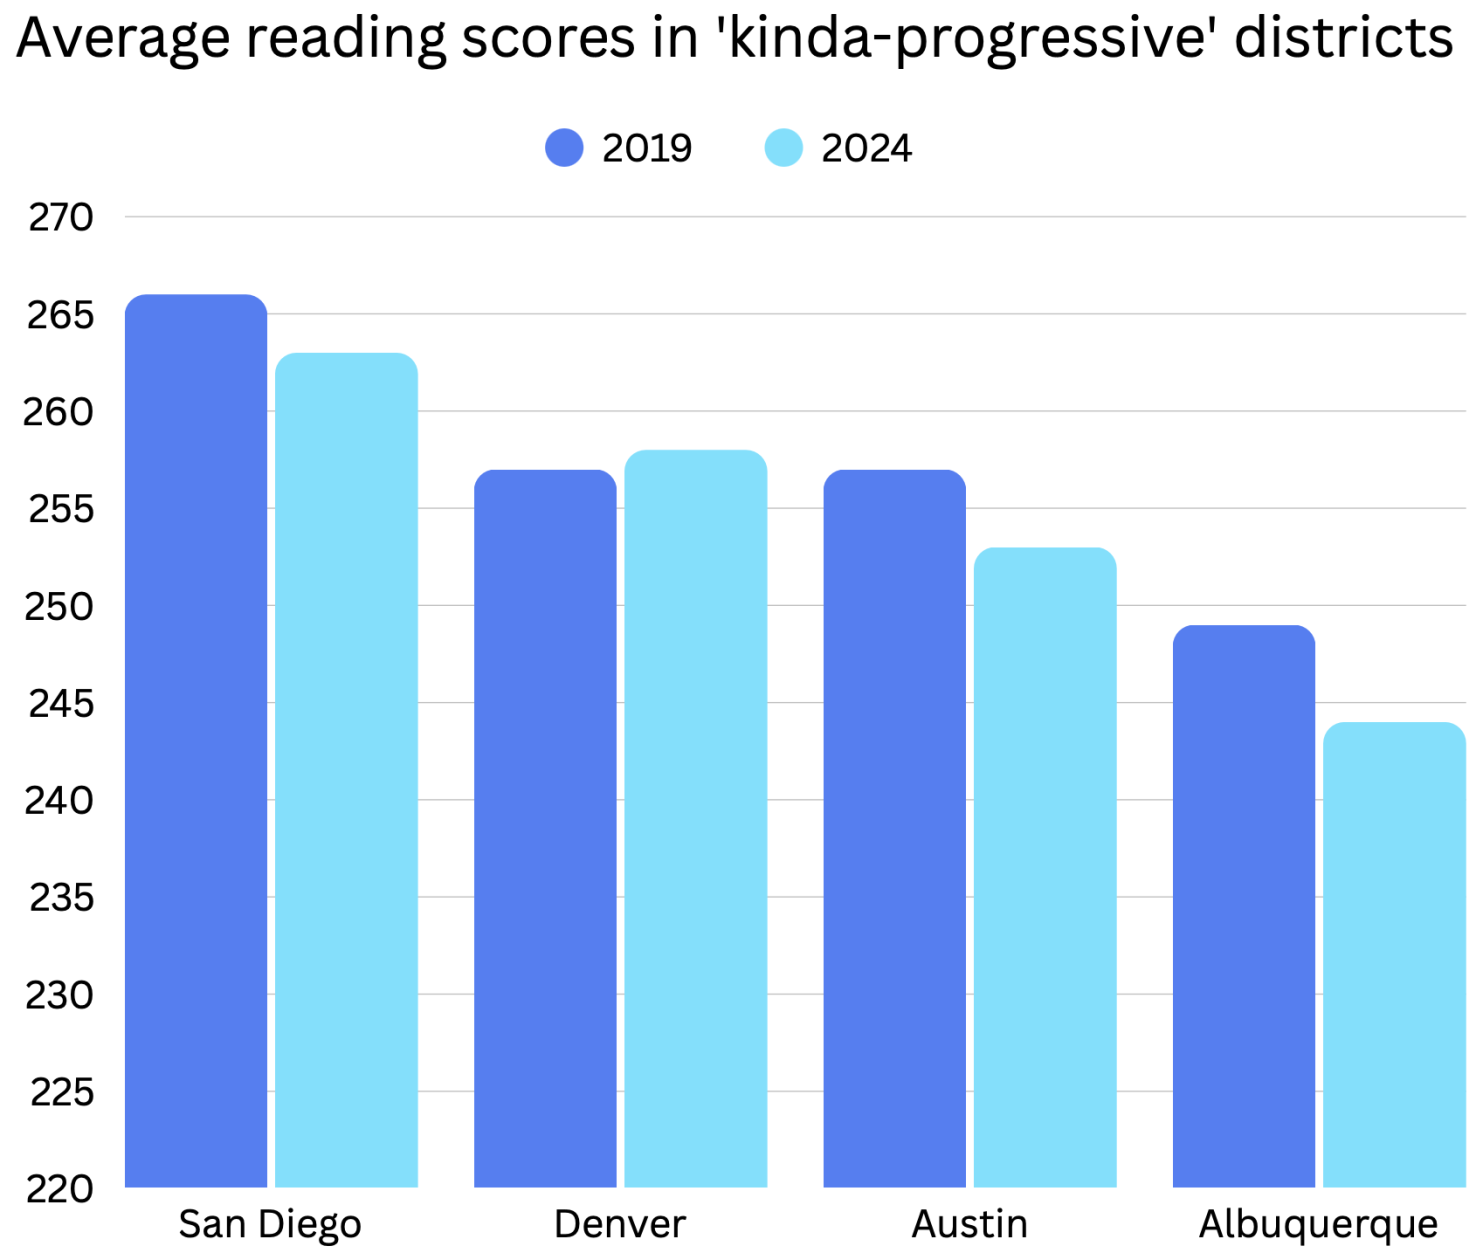
None of these districts lost more points than the national average, although on average they did about as badly as the districts containing inelastic cities (a 2.7 point loss on average as opposed to 2.1 for the first group).
And what about the more centrist districts? In 2019, four of the five top performers were moderate districts in more red/purple states: Miami-Dade, Charlotte, Hillsborough and Guilford. Each of the first three lost an above-average 7 points.
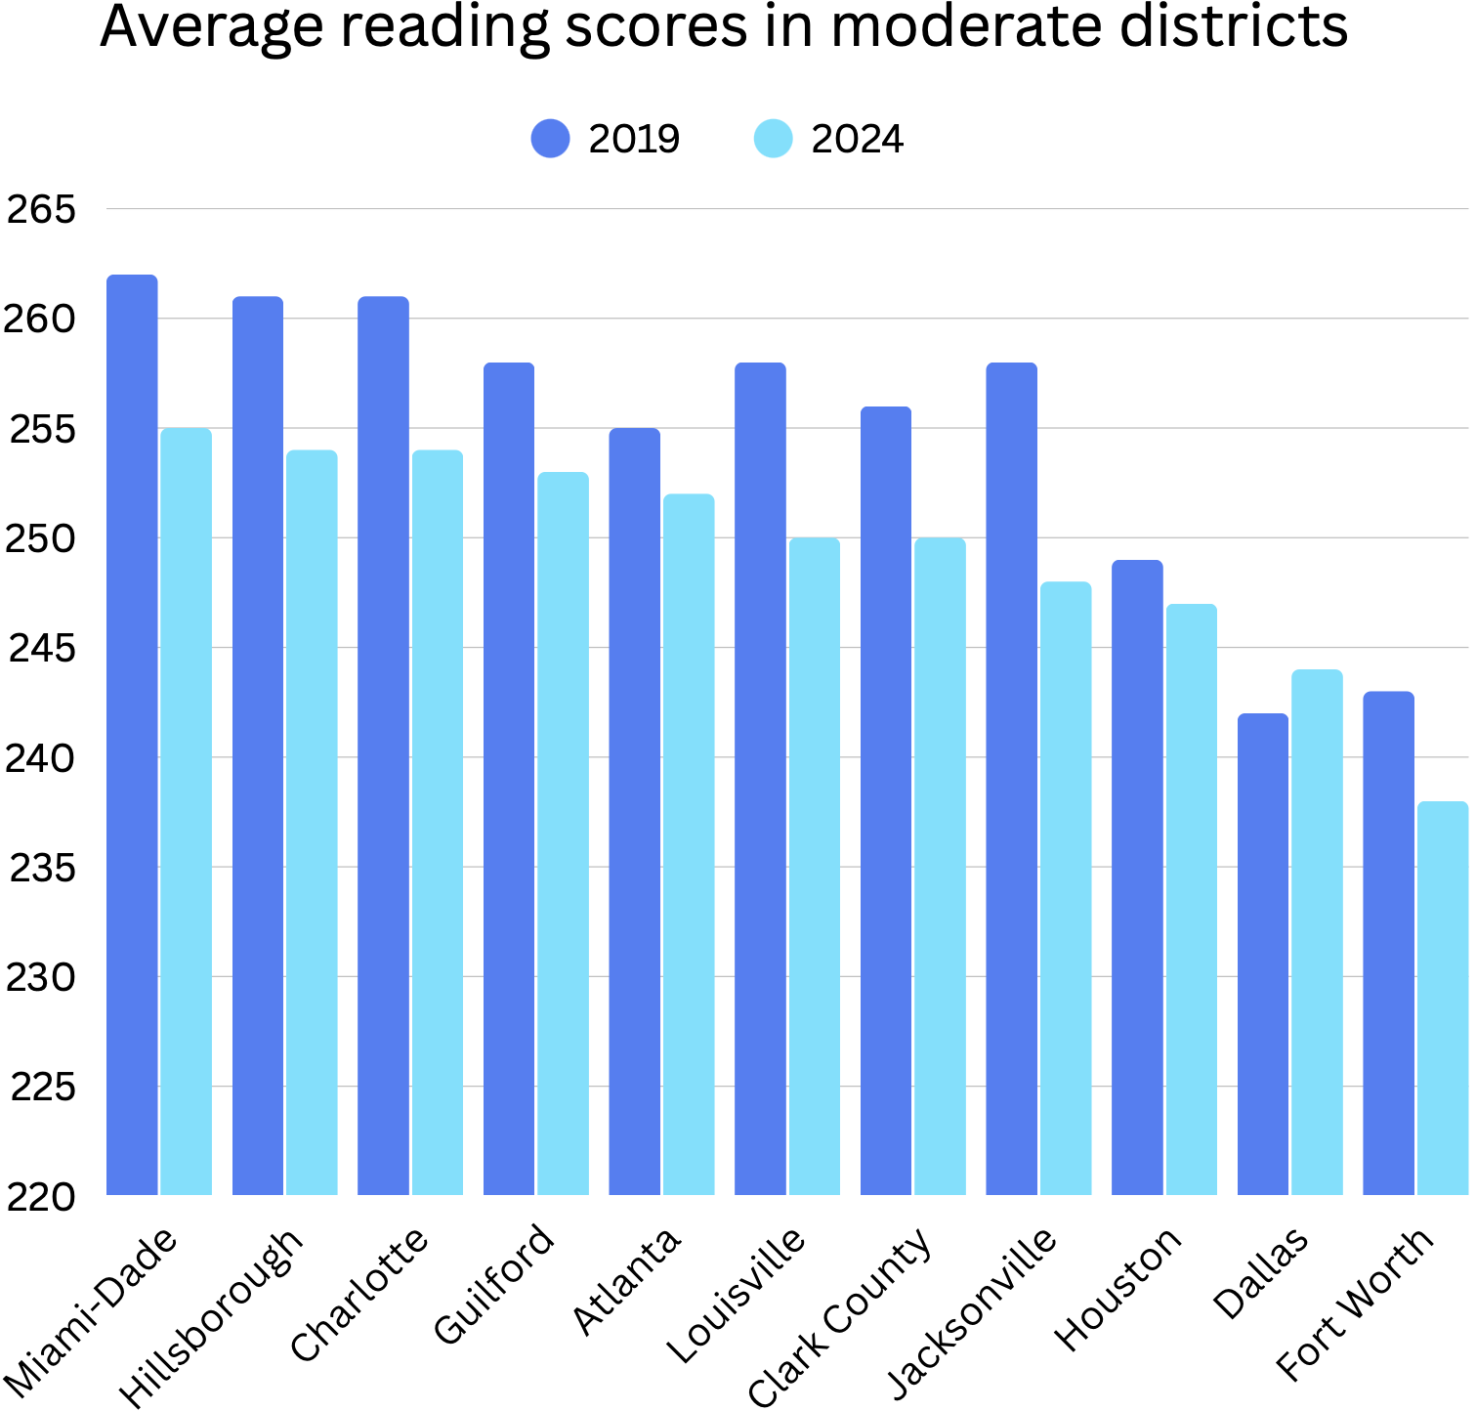
If I counted correctly, the average reading loss in this group was a bit over 5 points, roughly comparable to the national average and a few points worse than the more liberal districts. Six of the 11 lost more than five points, a higher percentage than for progressive cities — although none of them did as badly as Cleveland.**
An alert reader might notice that the more moderate districts had stronger scores to begin with, perhaps because they include more middle-income suburbs. Thus, one might have expected them to have larger declines, just as a million-person city might gain or lose more population in a year than a much smaller city. So what happens if I look at test score declines as percentages instead of raw numbers? Reading scores declined by over 2 percent in three relatively progressive cities (Boston, Cleveland and Albuquerque) and in eight more moderate districts (Miami, Hillsborough, Charlotte, Guilford, Louisville, Clark County, Jacksonville and Fort Worth). So, even controlling for their higher pre-2020 scores, the moderate districts lost a bit more ground.
Mathematics scores show an even steeper drop
What about mathematics? I have been reading a lot of media commentary suggesting that smartphones have rotted away Americans’ ability to read, and expected American 8th-graders to have lost less ground in math than in reading. But in fact, national math scores declined by more than reading scores: the average 8th-grade score declined by 8 points, from 282 to 274. While five urban districts improved slightly in reading (Dallas, Denver, Los Angeles, Washington and Chicago), not one had better math scores in 2024 than in 2019.
Although math scores declined everywhere, some progressive districts did worse than others.
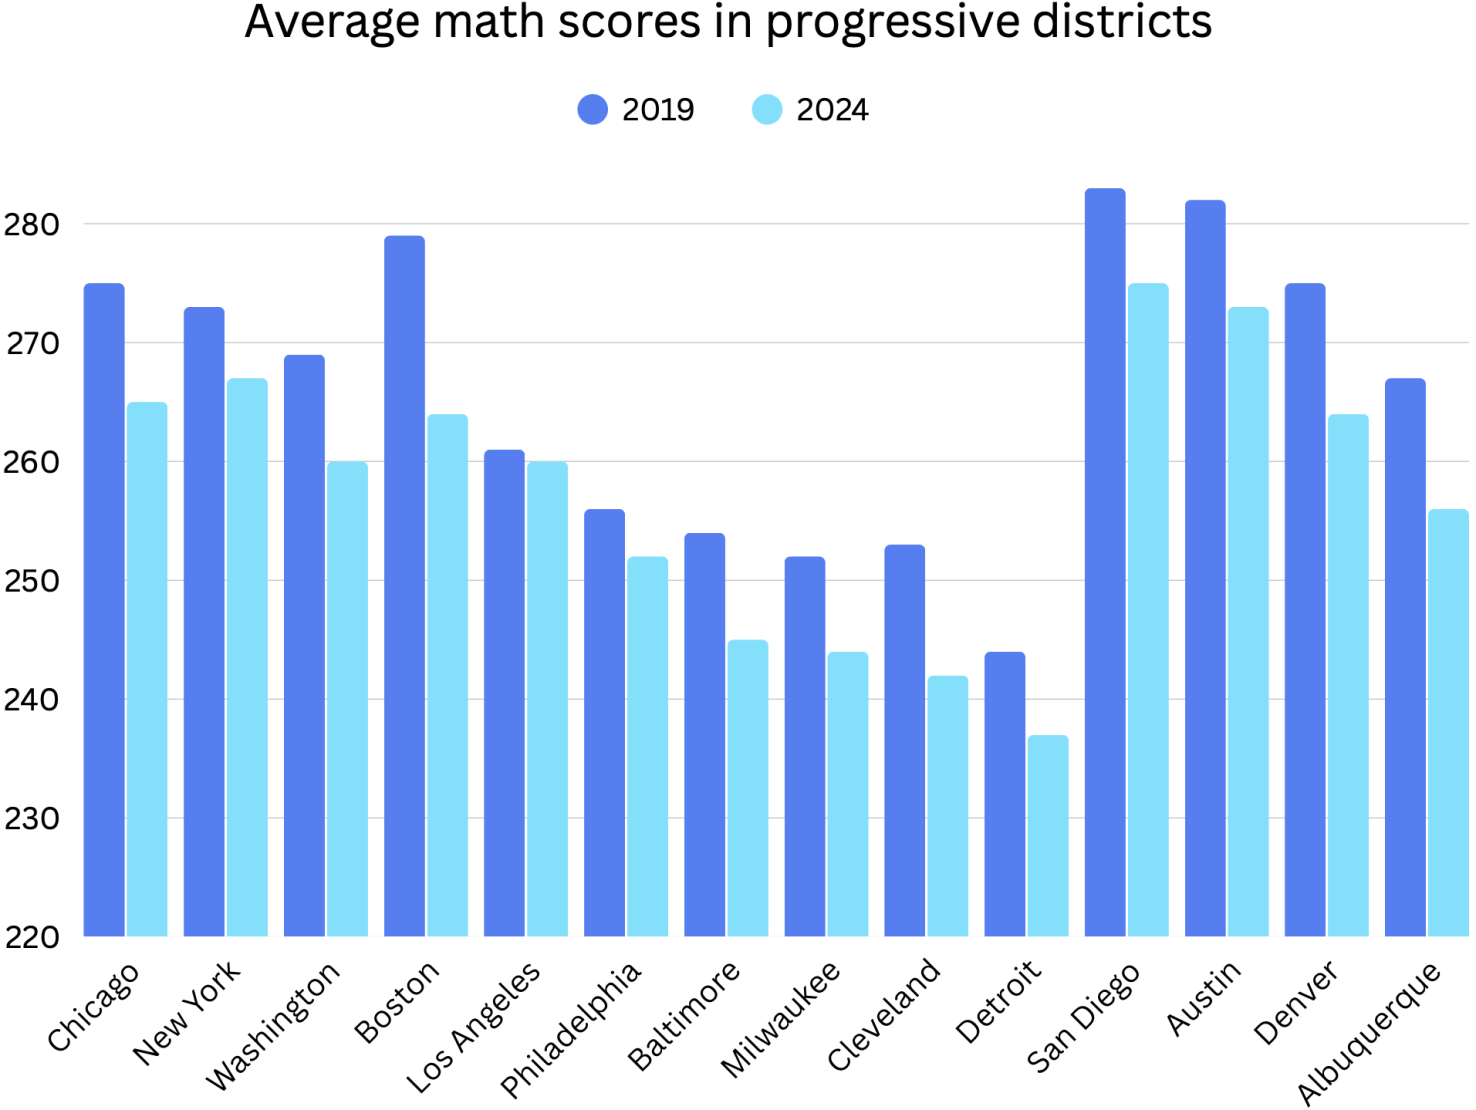
If I am counting correctly, the average decline for my left-leaning group was 8.5 points, and the median decline was 9 points.
Mathematics scores also declined in more centrist school districts.
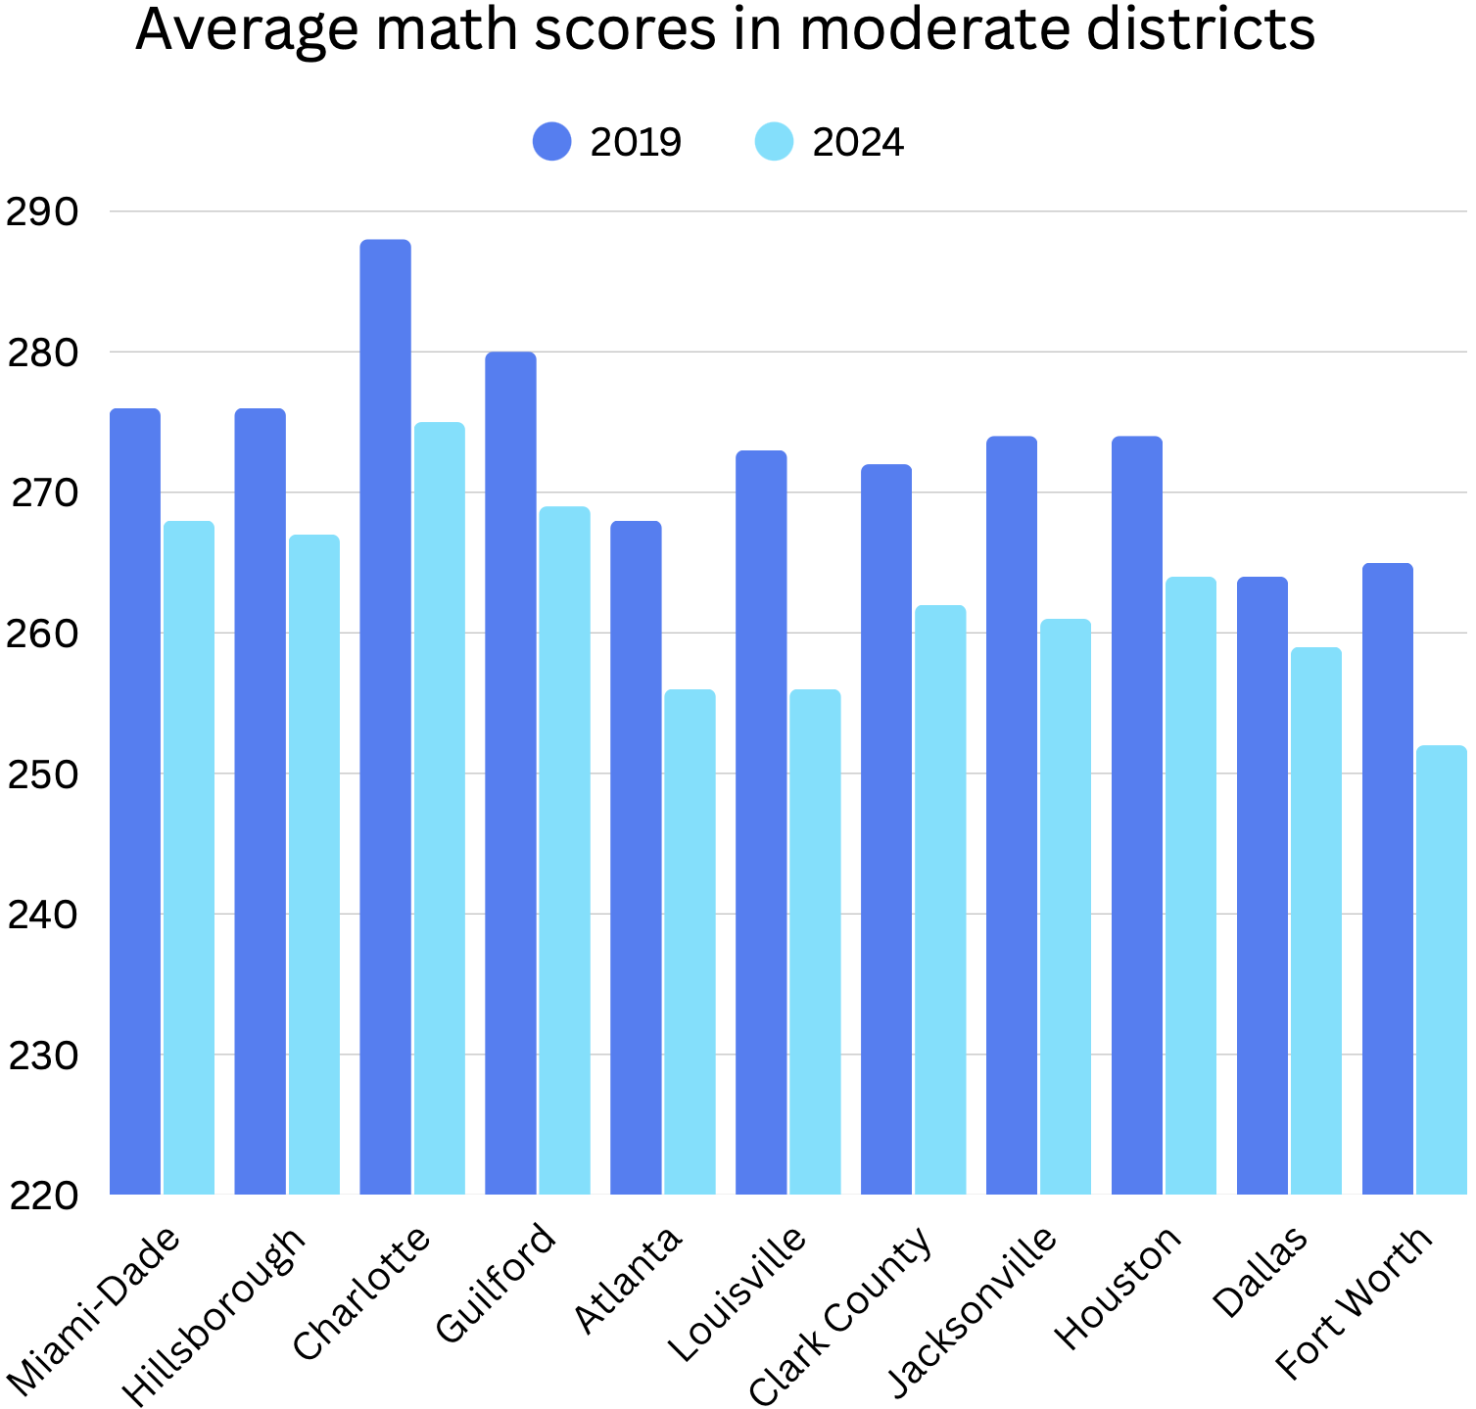
To put it another way, the median decline for my more right-leaning districts was 11 points, and the average decline was also 11 points.
However, if math decline is measured by percentage losses over the 2019-24 period, the difference between leftish and moderate districts arguably narrows but does not entirely disappear. Math scores declined by over 2% in every district but two (Los Angeles and Philadelphia). Math scores declined by over 4 percent in four of the 14 left-leaning districts (Denver, Boston, Albuquerque and Cleveland) and five of the 11 more moderate districts (Charlotte, Jacksonville, Atlanta, Louisville and Fort Worth).
In sum, it looks like test scores declined in most urban districts, as they did in most of the United States, but somewhat to my surprise,*** there doesn’t seem to be a consistent pattern of leftish school districts losing more ground than more centrist districts.
—
*The Nation’s Report Card website has ample data on both eighth-grade scores and fourth-grade scores. I chose to focus on eighth-grade scores because 1) of the limitations of space for a blog post and 2) it seems to me that a school district has more time to experiment on eighth-graders than on fourth-graders, and thus that the former group is a better measurement of school performance.
** On a related note, Angie Schmitt, whose work on street safety I have written extensively about, has a Substack that often covers the deficiencies of Cleveland schools.
***Why “to my surprise”? Partially because of my own preexisting biases, but partially because, as I wrote in earlier posts, crime does seem to have increased to a greater extent in more left-leaning cities during the early 2020s.


2020 Population Growth Rates for the 50 Biggest U.S. Cities
The Census Bureau released new data on May 27 that includes the first four months of the pandemic. Seattle tops the growth rate at 2.2% from July 1, 2019, to July 1, 2020, while Baltimore and San Francisco land at the bottom with -1.4%.
Racism Has Shaped Public Transit, and It’s Riddled with Inequities
Former Houston METRO Board Member Christof Spieler highlights the racism embedded even in the way transit agencies were created.

Boomtowns No Longer Attract Waves of New Workers
The latest Upshot by Emily Badger looks at why American cities with the greatest economic opportunity no longer attract the population increases of yore

Planetizen Federal Action Tracker
A weekly monitor of how Trump’s orders and actions are impacting planners and planning in America.
Data reveals that NYC’s bet on congestion pricing has paid off
After almost two years of the program, reports show positive impacts on traffic and air quality and no disruptions to parking.
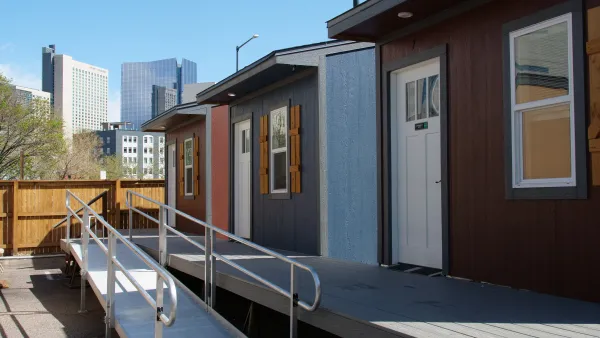
Denver is solving homelessness. Why aren't the rest of us?
Since 2023, Denver's street homeless population has decreased by 64%, proving that effective tools exist to support those in need of housing.

CA city to shut down airport, transform it into utopian park
The western side of the 200-acre park will feature a dog park, nature education center and arboretum.

NYC to vote on supporting outdoor dining, streamlining bus and bike lane creation
The city has five proposed amendments to its municipal constitution on the ballot this November.

Chicago breaks ground on $3 billion megadevelopment
The new neighborhood, titled Foundry Park, will one day host 3,700 residences.

FREE Course: Walkable City 1: Why Walkability?
After describing his path towards focusing on walkability as the essence of good planning, Jeff Speck marches through his five principal reasons for making more walkable places.
Reinventing Malls: Planning Alchemy—Turning Gray Fields Into Gold
The course focuses on the opportunities and imperatives that shape reinvention of mall sites.

City of Rosemead
Rutgers University, Edward J. Bloustein School of Planning and Public Policy
One Hundred Miles
The Architects Foundation
University of Cincinnati Online
Montrose County
Northern Illinois Transit Authority (NITA)
The Pocatello Development Authority

