KPCC has published an interactive map showing the publicly funded affordable housing developments in Los Angeles County.


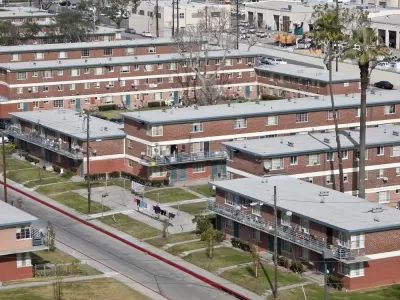
Rina Palta and Aaron Mendelson share the results of a mapping project that shows the location of publicly funded affordable housing developments. According to the analysis, public housing projects in Los Angeles County are overwhelmingly located in the poorest neighborhoods in the county.
"According to a KPCC analysis of state treasurer records and U.C. Census data, nearly two-thirds of projects funded over the past decade using the Low-Income Housing Tax Credit program in L.A. County have gone into areas where the average household earns less than $40,000 a year," the article explains.
With that reality as a background, advocates, researchers, and developers are building a case to allow more equitable distribution of public housing projects across the county. Palta and Mendelson are able to offer many examples of the case for fair distribution of affordable housing failing to win support from residents (not to mention political will from local and regional officials) around the county, however.
Read the full story: How affordable housing in LA reinforces economic segregation
HUD to Investigate Minneapolis Over Allegations of ‘Racial and Ethnic Favoritism’ in Housing Policy
The Trump administration says the city’s housing policies and support of ‘cultural districts’ are racially discriminatory, while city leaders call the investigation politically motivated.

L.A. Councilmember Proposes Social Housing Model
Inspired by the success of Vienna, Austria, Los Angeles leaders are considering public housing as a faster, more effective way to curb the city’s homelessness crisis.

L.A. Planners Working to Shift Affordable Housing Distribution for More Equitable Results
Almost all the affordable housing development in L.A. in the past decade has occurred in majority-minority neighborhoods. The L.A. Department of City Planning is looking for ways to make sure high-income areas do more of their fair share.

Planetizen Federal Action Tracker
A weekly monitor of how Trump’s orders and actions are impacting planners and planning in America.

Eastern Nebraska is running out of electricity
Data centers and electrification are straining eastern Nebraska’s grid, throttling economic development.

Study reveals best places in the U.S. for cycling, walking
New research from Streetlight Data examines bicycle and pedestrian miles per capita in the 100 largest U.S. cities by population.

DSA members accuse Mamdani of 'abandoning values' over housing redevelopment
New York City's mayor plans to replace about 2,000 units of public housing with private, mixed-income housing.

All sides of BRT debate unhappy with CDOT’s most recent move
The Colorado Department of Transportation is no longer considering center-running bus lanes for Colorado Boulevard.

Massachusetts bogs generate both power, and cranberries
Putting solar panels above farmland is one way Massachusetts is advancing toward its goal of net-zero carbon emissions by 2050.

FREE Course: Walkable City 1: Why Walkability?
After describing his path towards focusing on walkability as the essence of good planning, Jeff Speck marches through his five principal reasons for making more walkable places.
Reinventing Malls: Planning Alchemy—Turning Gray Fields Into Gold
The course focuses on the opportunities and imperatives that shape reinvention of mall sites.

City of Rosemead
Rutgers University, Edward J. Bloustein School of Planning and Public Policy
One Hundred Miles
University of Michigan School for Environment and Sustainability (SEAS)
Hunter College, City University of New York (CUNY)
The Architects Foundation
City of Cambridge
The Pocatello Development Authority
The Urban Renewal Agency of the City of Pocatello