


The Lawrence Livermore National Laboratory (LLNL) released its annual energy flowchart.
David Roberts shares news of "a new spaghetti diagram from Lawrence Livermore National Laboratory (LLNL) at the Department of Energy."
"Every year, LLNL produces a new energy flow chart showing the sources of US energy, what it’s used for, and how much of it is wasted," according to Roberts.
Roberts also prepares us to have our minds blown, both in how much energy the United States consumes and how much it wastes, classified as "rejected" energy. "Not just some, but almost two-thirds of the potential energy embedded in our energy sources ended up wasted in 2016," according to Roberts's explanation.
Other focuses of Roberts's interrogation of the chart include the changing nature of the nation's electricity grid and a lack of change in the energy consumption of the nation's fleet of private and commercial vehicles.
FULL STORY: American energy use, in one diagram

A Path for California to Get to Zero Carbon...And Below
A new study from Lawrence Livermore National Laboratory evaluates strategies to achieve former Gov. Jerry Brown's goal of carbon neutrality by 2045. Unlike other reports that study emission reductions, it evaluates "negative emissions" strategies.

How Smart Street Lights Can Help Cities Achieve Sustainability Goals
Switching to energy-efficient LEDs and using tech to program when and how street lighting operates can save cities millions in electricity expenses and bring down carbon emissions.
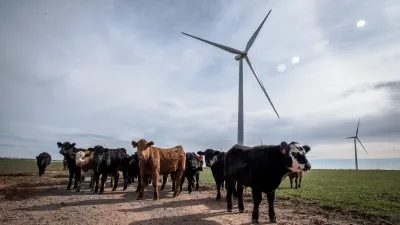
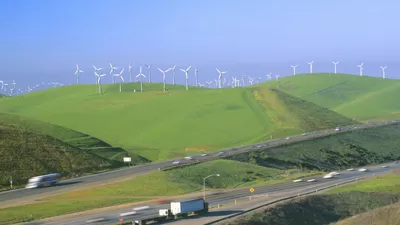
Renewable Energy Overtakes Coal for First Time
Solar and wind power generated close to a third of U.S. electricity supplies in 2024.

Maui's Vacation Rental Debate Turns Ugly
Verbal attacks, misinformation campaigns and fistfights plague a high-stakes debate to convert thousands of vacation rentals into long-term housing.

Planetizen Federal Action Tracker
A weekly monitor of how Trump’s orders and actions are impacting planners and planning in America.

San Francisco Suspends Traffic Calming Amidst Record Deaths
Citing “a challenging fiscal landscape,” the city will cease the program on the heels of 42 traffic deaths, including 24 pedestrians.

Defunct Pittsburgh Power Plant to Become Residential Tower
A decommissioned steam heat plant will be redeveloped into almost 100 affordable housing units.

Trump Prompts Restructuring of Transportation Research Board in “Unprecedented Overreach”
The TRB has eliminated more than half of its committees including those focused on climate, equity, and cities.

Amtrak Rolls Out New Orleans to Alabama “Mardi Gras” Train
The new service will operate morning and evening departures between Mobile and New Orleans.
Urban Design for Planners 1: Software Tools
This six-course series explores essential urban design concepts using open source software and equips planners with the tools they need to participate fully in the urban design process.
Planning for Universal Design
Learn the tools for implementing Universal Design in planning regulations.
Heyer Gruel & Associates PA
JM Goldson LLC
Custer County Colorado
City of Camden Redevelopment Agency
City of Astoria
Transportation Research & Education Center (TREC) at Portland State University
Jefferson Parish Government
Camden Redevelopment Agency
City of Claremont