


A French economist created a powerful visualization of the rise of carbon emission hot spots from a few locations in Europe to every developed and developing corner of the world.
Laura Bliss shares news of a new interactive map that charts global emissions over the course of 260 years.
Bliss explains the origin story of the map:
"French economist Aurélien Saussay created the map (and the animated video, below) using data from the U.S. Department of Energy’s Carbon Dioxide Information Analysis Center, which tracks fossil-fuel burning (plus concrete production and gas flares) all the way back to 1751—the beginning of the fossil fuel era."
Bliss also explains how to use the tool, and a few insights to begin your exploration:
"Use the red slider to move back and forth through time, and click on any country to see how their carbon contributions measured up against the world’s total. As the birthplace of the Industrial Revolution, Europe was the carbon hotspot for a close to a century. It wasn’t until 1891 that the U.S. surpassed the U.K. as Earth’s leading CO2 polluter—which it stayed until just a decade ago, when China took up that ignominious title."
And there is also the short video below providing a glimpse into the world's carbon addiction.
FULL STORY: Mapping 260 Years of Global Carbon Emissions

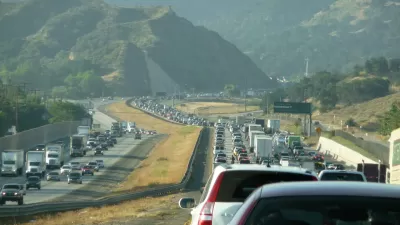
A Detailed Map of the Nation's Auto Emissions
The New York Times illustrates the scope and scale of the great project still facing the United States: to decrease greenhouse gas emissions from the transportation sector of its economy.
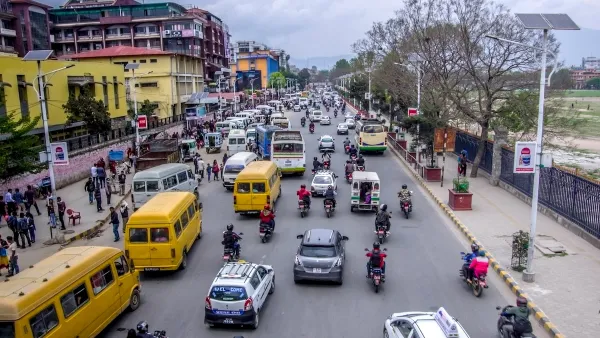
The Small South Asian Republic Going all in on EVs
Thanks to one simple policy change less than five years ago, 65% of new cars in this Himalayan country are now electric.
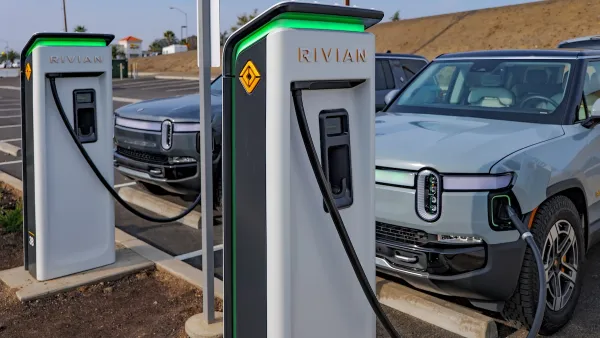
US Senate Reverses California EV Mandate
The state planned to phase out the sale of gas-powered cars by 2035, a goal some carmakers deemed impossible to meet.

Planetizen Federal Action Tracker
A weekly monitor of how Trump’s orders and actions are impacting planners and planning in America.
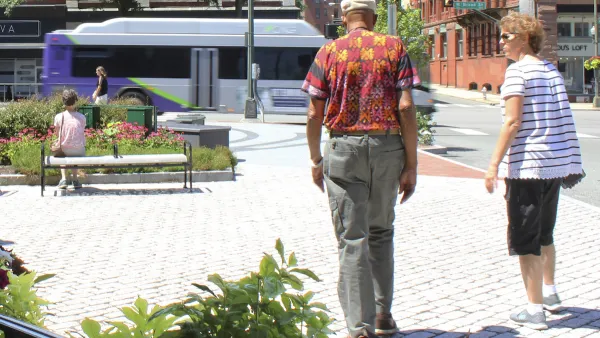
Vehicle-related Deaths Drop 29% in Richmond, VA
The seventh year of the city's Vision Zero strategy also cut the number of people killed in alcohol-related crashes by half.

Can We Please Give Communities the Design They Deserve?
Often an afterthought, graphic design impacts everything from how we navigate a city to how we feel about it. One designer argues: the people deserve better.

Judge Halts Trump Order Tying State Transportation Grants to Immigration Actions
Ruling applies to Colorado, which was among 20 plaintiff states.

New York MTA to Reimagine Subway Bottleneck
Changes proposed in a recently approved five-year plan would resolve a nearly century-old snarl that routinely delays trains.

Southern Californians Survey Trees for Destructive Oak Pest
Hundreds of volunteers across five counties participated in the first Goldspotted Oak Borer Blitz, surveying oak trees for signs of the invasive beetle and contributing valuable data to help protect Southern California’s native woodlands.
Urban Design for Planners 1: Software Tools
This six-course series explores essential urban design concepts using open source software and equips planners with the tools they need to participate fully in the urban design process.
Planning for Universal Design
Learn the tools for implementing Universal Design in planning regulations.
Borough of Carlisle
Smith Gee Studio
City of Camden Redevelopment Agency
City of Astoria
Transportation Research & Education Center (TREC) at Portland State University
City of Camden Redevelopment Agency
Municipality of Princeton (NJ)