


Statistics sage Nate Silver crunches the numbers illustrating the relationship between U.S. cities' overall diversity and their neighborhood diversity. His conclusion: the greater diversity, the greater the segregation.
Cities often consider diversity to be among their great assets. And American cities have diversity in spades. But as anyone who's ever visited Watts, Hyde Park, Bel Air, or the Upper West Side knows, the experience of diversity often does not match up with the statistics on diversity.
Celebrity statistician Nate Silver has taken this notion and analyzed the data not just for cities' overall diversity—which is highest in Jersey City, N.J., Oakland, Calif., and Sacramento, Calif. and lowest in Laredo, Tex., Hialeah, Fla., and Scottsdale, Ariz.—but also for cities' neighborhood diversity. Comparing the two, Silver concludes that some of America's most diverse cities are actually some of the most segregated.
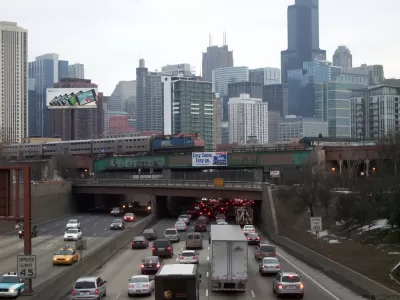
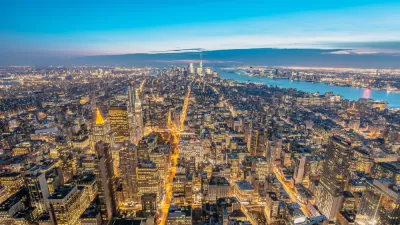
"A few cities actually get pretty close to this ideal of complete diversity. Oakland, California, is not far from being evenly divided between whites, blacks, Hispanics and Asians; its citywide diversity index is 75 percent. New York’s is 73 percent. And Chicago’s is 70 percent. At the low end of the scale are extremely white cities like Lincoln and Scottsdale, Arizona. There’s also extremely black cities like Detroit, and extremely Hispanic cities like Laredo, Texas. Laredo, which is almost entirely Hispanic, has a citywide diversity index of just 8 percent."
"You can have a diverse city, but not diverse neighborhoods. Whereas Chicago’s citywide diversity index is 70 percent, seventh best out of the 100 most populous U.S. cities, its neighborhood diversity index is just 36 percent, which ranks 82nd. New York also has a big gap. Its citywide diversity index is 73 percent, fourth highest in the country, but its neighborhood diversity index is 47 percent, which ranks 49th."
"The integration-segregation index is determined by how far above or below a city is from the regression line. Cities below the line are especially segregated. Chicago, which has a -19 score, is the most segregated city in the country. It’s followed by Atlanta, Milwaukee, Philadelphia, St. Louis, Washington and Baltimore."
FULL STORY: The Most Diverse Cities Are Often The Most Segregated

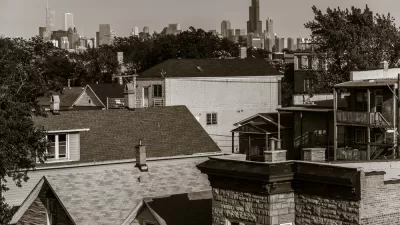
Black Chicagoans Segregated, Regardless of Income
Latino Chicagoans are more likely to live in diverse neighborhoods than whites or blacks do.

How Cities Can Avoid Perpetuating Segregation
Residents of big cities, known as the ‘melting pots’ of America, have fewer interactions with people outside their socioeconomic group than those in smaller communities, according to new research.
Design Collective Using Black-Centered Approaches to Transform Cities
BlackSpace seeks to empower Black practitioners and change the way planning and design happens in and affects Black communities.

Planetizen Federal Action Tracker
A weekly monitor of how Trump’s orders and actions are impacting planners and planning in America.

The Simple Legislative Tool Transforming Vacant Downtowns
In California, Michigan and Georgia, an easy win is bringing dollars — and delight — back to city centers.
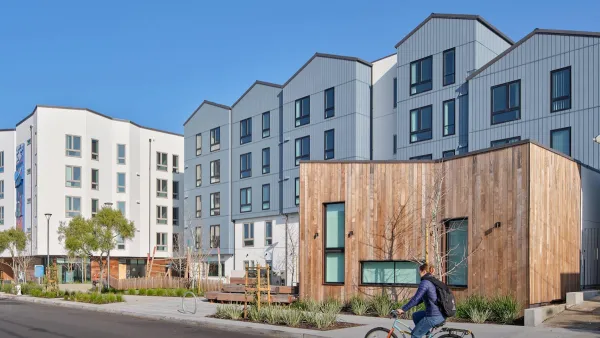
San Francisco's School District Spent $105M To Build Affordable Housing for Teachers — And That's Just the Beginning
SFUSD joins a growing list of school districts using their land holdings to address housing affordability challenges faced by their own employees.

In More Metros Than You’d Think, Suburbs are Now More Expensive Than the City
If you're moving to the burbs to save on square footage, data shows you should think again.

The States Losing Rural Delivery Rooms at an Alarming Pace
In some states, as few as 9% of rural hospitals still deliver babies. As a result, rising pre-term births, no adequate pre-term care and "harrowing" close calls are a growing reality.

The Small South Asian Republic Going all in on EVs
Thanks to one simple policy change less than five years ago, 65% of new cars in this Himalayan country are now electric.
Urban Design for Planners 1: Software Tools
This six-course series explores essential urban design concepts using open source software and equips planners with the tools they need to participate fully in the urban design process.
Planning for Universal Design
Learn the tools for implementing Universal Design in planning regulations.
Smith Gee Studio
City of Charlotte
City of Camden Redevelopment Agency
City of Astoria
Transportation Research & Education Center (TREC) at Portland State University
US High Speed Rail Association
City of Camden Redevelopment Agency
Municipality of Princeton (NJ)