


The Demographia International Housing Affordability Survey contains significant biases and errors. It is important that anybody working with the survey's results be aware of these problems.


Wendell Cox and Hugh Pavletich just released the 11th Annual Demographia International Housing Affordability Survey (IHAS). I criticized past editions of this survey in previous Planetizen columns, What is a 'House'? Critiquing the Demographia International Housing Affordability Survey and How Not To Measure Housing Affordability. The new edition is no better. I hope that everybody using the survey's results is aware of these problems. Let me describe some of them.
Unclear and Biased Analysis
Any good research clearly explains its assumptions, methods and data sources. The IHAS fails to do this. Although it includes a long list of sources “consulted,” there are no details about the information actually used so it is impossible to evaluate their methods and data accuracy. If Cox and Pavletich want to be taken seriously as researchers they must make their data available for peer review.
The sample of IHAS data I examined shows significant errors. For example, it reports that median Vancouver, BC housing prices are US$704,800 or CA$870,123, which is 36% higher than the CA$638,500 reported for December 2014 by the Real Estate Board of Greater Vancouver. Similarly, it reports median Victoria, BC housing prices at US$445,100 or CA$549,506, which is close to the CA$542,800 median price for single-family houses but not for the CA$444,736 weighted median price of single-family, townhouse and condominium sales. I therefore conclude that the IHAS analysis overweighs single-family housing and overlooks more compact housing types, as I described previously in What is a 'House'? If this is true, the Survey significantly exaggerates inaffordability problems in compact cities where townhouses and apartments are a major share of housing.
As a result, Vancouver's 10.6 Median Multiple (median annual income/median house sales price) appears to be exaggerated. Since townhouses prices are about half, and condominium prices about a third of single-family house prices, and only about half of all Vancouver region residential property sales are for single-family houses, the Median Multiple declines to 9.1 if calculated using a weighted average, 6.7 for townhouses and only 5.4 for apartments. Similarly, Victoria’s 6.7 Multiple Median declines to 6.3 using weighted values, and is 5.8 for townhouses and 4.2 for condominiums. Although these are still high, they are much lower than what IHAS indicates.
The graph below shows Vancouver’s median housing price trends. The red and green lines indicate large increases in single family-housing prices, while the orange and purple lines show much lower price increases for townhouses and apartments. Single-family housing is certainly expensive in Vancouver, as would be expected in a rapidly-growing, attractive, economically-successful, and geographically constained city, but townhouses and apartments are relatively affordable.
Vancouver Benchmark Housing Prices
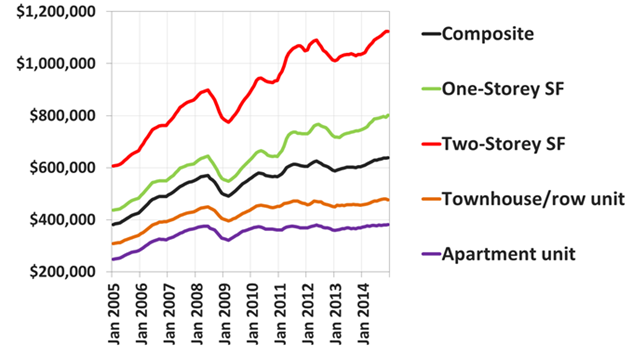
Vancouver region single-family housing prices increased significantly during the last five years, but townhouse and apartment prices have been flat.
Ignores Transportation Costs
Another important factor to consider when evaluating affordability is the scope of costs considered. Demographia’s Index only considers housing costs, but most experts now recommend that affordability be calculated based on combined housing and transportation costs in order to account for the trade-offs households often make between these costs. A cheap house is not truly affordable if located in an area with high transportation costs, and conversely, households can afford to spend more on housing in an accessible, multi-modal neighborhood where it is possible to reduce vehicle expenses. The Location Affordability Portal makes it easy to calculate and illustrate these impacts: it produces heat maps of housing costs, transportation costs, and housing and transportation costs combined for U.S. cities, as illustrated below.
Example of Location Affordability Portal Heat Map
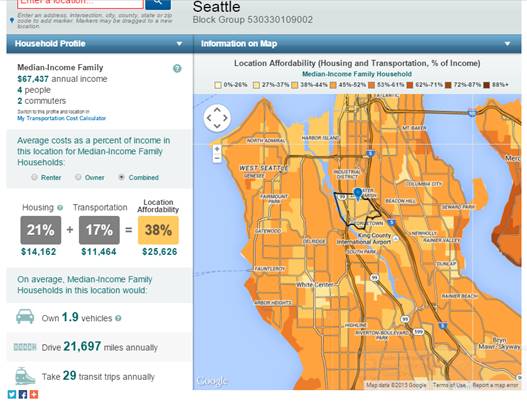
Sprawl looks affordable when evaluated based on housing costs alone, but compact, infill development turns out to be most affordable overall, considering both housing and transportation costs.
In automobile-dependent communities households typically devote 20-25% of their budgets to transportation, but this declines to 5-10% in accessible, multi-modal locations where it is easy to be car-free. As a result, in accessible, multi-modal cities such as Vancouver, households can increase the portion of their household budget devoted to housing from 25% to 40% and still stay within a 45% total limit, a 60% increase. This means that is a 4.0 Median Multiple is considered affordable in an automobile dependent location then a 6.4 Multiple is affordable in a transit-oriented neighborhood.
Described differently, although moderate-income Vancouver households may find single-family housing unaffordable, many can afford to purchase a townhouse or condominium in a walkable and transit-oriented neighborhood if they reinvest their transportation cost savings into their mortgage payments. It is therefore inaccurate to simply categorize Vancouver as unaffordable: single-family housing in popular neighborhoods may be, but not housing overall.
The cheapest housing to construct is generally low-rise, wood frame, multi-family housing in a smart growth location because it minimizes construction and land costs, and requires no parking, as illustrated in the following graph. High-rise, concrete buildings cost more to construct but require less land per unit, and so become cost-effective when land prices are very high (over about $10 million per acre). This indicates that in most urban neighborhoods, smart growth policies that support two- to five-story, wood frame adjacent and multi-family housing in accessible, multi-modal neighborhoods tend to maximize overall affordability.
Typical Building Construction Costs
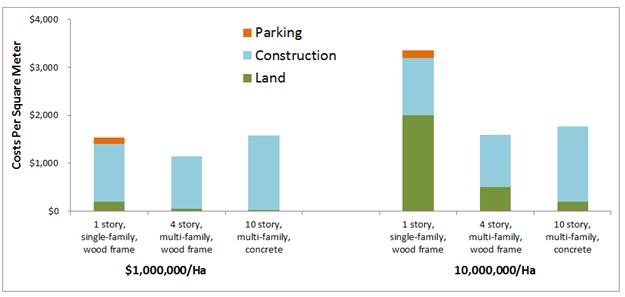
Wood frame multi-family housing tends to have the lowest construction and land costs, and so is generally most affordable overall. Concrete construction costs about 50% more, but can be taller, which reduces land costs and so becomes cost-effective with high land prices.
These same pattern occurs in developing countries. A recent study I co-authored with professors Ali A. Isalou and Behzad Shahmoradi, Testing The Housing And Transportation Affordability Index In A Developing World Context: A Sustainability Comparison Of Central And Suburban Districts In Qom, Iran, applied Housing and Transportation (H+T) Affordability Index analysis to neighborhoods in Qom City, Iran. The results indicate that in that suburban-area households spend more than 57% of their monthly income on housing and transport, significantly more than the 45% spent by households in the central district. This illustrates why it is important to apply comprehensive housing and transportation affordability analysis in developing as well as developed countries.
This is not to suggest that everybody needs to live in multi-family housing, but there is no reason that public policies should favor single-family housing development. Current demographic and economic trends are increasing demand for more compact housing in accessible, multi-modal locations; meeting this demand by helping developers build more townhouses and apartments in walkable and transit-oriented neighborhoods provides significant direct and indirect benefits, more net benefits than further urban expansion.
Misdiagnoses The Causes of Inaffordability
Cox and Pavletich have an obvious political agenda: they oppose smart growth and want to prove that it harms households. Their Survey and other Demographia publications assume that smart growth consists only of urban containment regulations which are the primary cause of housing inaffordability (see the Survey's Table 1 titled, “LAND USE REGULATION CLASSIFICATIONS”).
These assumptions are wrong in several ways. Smart growth does not prohibit appropriate expansion, it is concerned with the way cities expand. Although some smart growth policies increase development regulations, others reduce regulations or improve affordable housing and transportation options in response to consumer demands.
Smart Growth Impacts on Regulations
|
Increased Regulations |
Reduced Regulations |
Improved Affordable Options |
|
|
|
Smart growth increases some regulations but reduces others, improves consumer options and applies more efficient pricing which tends to benefit most residents overall.
Many smart growth policies increase affordability by removing barriers to more compact, affordable housing types (multi-family, secondary suites, apartments over shops, loft apartments, etc.), reducing parking requirements, and reducing transport costs.
Smart Growth Household Affordability Impacts
|
Reduces Affordability |
Improved Affordable Options |
|
|
|
Many smart growth strategies can increase housing and transportation affordability.
Other researchers reach similar conclusions. in a review of development regulations in 25 typical U.S. jurisdictions, Lewyn and Jackson found that sprawl-inducing regulations, such as density limits and minimum parking requirements, are far more common than sprawl-reducing regulations such as urban growth boundaries, parking maxima and density minima. Another study, “A New Measure of the Local Regulatory Environment for Housing Markets: The Wharton Residential Land Use Regulatory Index found that urban containment regulations do not significantly increase housing costs, instead the study found that restrictions on parcel subdivision, which prevent larger-lot single-family parcels from being converted to more compact housing types in existing urban areas, are the primary contributor to housing inaffordability. A terrific column, How Burrowing Owls Lead To Vomiting Anarchists (Or SF’s Housing Crisis Explained) by Kim-Mai Cutler describes how restrictions on infill development and building height tend to reduce housing affordability in growing, successful cities such as San Francisco. This indicates that smart growth policies that allow more compact, infill development tend to increase housing affordability.
The Cox and Pavletich are also wrong to assume that the high Median Multiple values in cities such as Hong Kong, Vancouver, Sydney and San Francisco demonstrate that smart growth reduces housing affordability or that urban expansion will reduce housing costs in those cities. These cities are rapidly growing, attractive, economically successful, and geographically constrained by political boundaries, oceans, mountains, valuable farmlands and unique wildlife habitat; it is inappropriate to compare their single-family housing prices with those in slower-growing, uncontained urban regions, and it is inappropriate to assume that their high housing costs result from urban containment or that removing such regulations will increase overall affordability.
Described differently, restrictions on urban expansion do not necessarily drive up housing prices unless they are combined with policies and regulations that discourage development of compact, affordable infill housing (such as townhouses and mid-rise apartments). Even if sprawl reduces housing costs, much of the savings may be offset by increased transportation costs. Policies that allow more affordable infill development tend to be better overall, considering all costs.
As a result, smart growth tends to provide overall financial savings (housing and transportation costs), plus other benefits. Sophisticated statistical analysis of U.S. urban regions, Ewing and Hamidi found that the portion of household income spent on housing is greater but the portion of income spent on transportation is lower, in smart growth communities: Each 10% increase in an index score was associated with a 1.1% increase in housing costs and a 3.5% decrease in transportation costs relative to income. Since transportation costs decline faster than housing costs rise, this results in a net decline in combined housing and transportation costs. Their research indicates that smart growth provides other economic, social and environmental benefits including large reductions in per capita traffic fatality rates, reduced obesity, improved health and longevity, and upward mobility (probability a child born to a family in the bottom income quintile reaches the top quintile by age 30). Smart growth urban policies that support more compact, urban infill development also tend to increase economic productivity.
Summary
It is important to apply accurate and comprehensive analysis when evaluating affordability. The Demographia International Housing Affordability Survey is currently the most comprehensive source of data on housing prices relative to incomes, so it is widely used. However, Cox and Pavletich have a political agenda: they support sprawl and oppose smart growth. As a result, their analysis incorporates various biases and omissions. It appears to overweight single-family house prices which exaggerates housing inaffordability in more compact cities, overlooks ways that smart growth increases affordability, and it ignores other smart growth benefits.
I raised these concerns previously, but Cox and Pavletich have yet to respond or improve their analysis. If they want their research to be taken seriously, they should be more transparent in their methods and data, and incorporate peer review in their process. Until that occurs, it is important that anybody using the International Housing Affordability Survey understand its biases and omissions.
For More Information
Affordable Housing Resource Center.
CNT (2006), Paved Over: Surface Parking Lots or Opportunities for Tax-Generating, Sustainable Development?, Center for Neighborhood Technology.
Housing + Transportation Affordability Index, Center for Neighborhood Technology.
CTOD and CNT (2006), The Affordability Index: A New Tool for Measuring the True Affordability of a Housing Choice, Center for Transit-Oriented Development and the Center for Neighborhood Technology, Brookings Institute.
CTOD (2009), Mixed-Income Housing Near Transit: Increasing Affordability With Location Efficiency, Center for Transit-Oriented Development and Reconnecting America.
Kim-Mai Cutler (2014), How Burrowing Owls Lead To Vomiting Anarchists (Or SF’s Housing Crisis Explained), Techcrunch.
FTA (2008), Better Coordination of Transportation and Housing Programs to Promote Affordable Housing Near Transit, Federal Transit Administration, USDOT and Department of Housing and Urban Development.
Ali A. Isalou, Todd Litman and Behzad Shahmoradi (2014), “Testing The Housing And Transportation Affordability Index In A Developing World Context: A Sustainability Comparison Of Central And Suburban Districts In Qom, Iran," Transport Policy, Vol. 33, May pp. 33-39.
Todd Litman (2010), Parking Requirement Impacts on Housing Affordability, Victoria Transport Policy Institute.
Todd Litman (2011), Understanding Smart Growth Saving, Victoria Transport Policy Institute.
Todd Litman (2010), Affordable-Accessible Housing In A Dynamic City: Why and How To Support Development of More Affordable Housing In Accessible Locations, Victoria Transport Policy Institute.
Location Affordability Publications.
Simon McDonnell, Josiah Madar and Vicki Been (2011), “Minimum Parking Requirements And Housing Affordability in New York City,” Housing Policy Debate, Vol. 21, No. 1, January, pp. 45 – 68; based on A Continuing Role for Minimum Parking Requirements in a Dense Growing City?, Furman Center for Real Estate and Urban Policy.
Metro Vancouver (2012), What Works: Affordable Housing Initiatives in Metro Vancouver Municipalities, Metro Vancouver Regional Housing.
Gary Pivo (2013), The Effect Of Transportation, Location, And Affordability Related Sustainability Features On Mortgage Default Prediction And Risk In Multifamily Rental Housing, University of Arizona for Fannie Mae. Also see, Walk Score and Multifamily Default: The Significance of 8 and 80.
Vancouver EcoDensity is an integrated program to increase urban livability, affordability and environmental performance through policy and planning reforms that encourage more compact, mixed, infill development.


Smart Growth Policies for Urban Affordability and Fertility
The new International Housing Affordability Survey contains various errors and biases. The author even claims that compact housing reduces fertility. Really? Smart policies can create affordable and family-friendly housing.

How Not To Measure Housing Affordability
Critics argue that smart growth reduces housing affordability. Their criticisms are partly legitimate and largely wrong, based on incomplete and biased analysis.

To Build More Housing, Cities Must Be Smarter in How They Use Land
How strategic land use policy decisions can alleviate the housing crisis and limit unsustainable sprawl.

Planetizen Federal Action Tracker
A weekly monitor of how Trump’s orders and actions are impacting planners and planning in America.

Chicago’s Ghost Rails
Just beneath the surface of the modern city lie the remnants of its expansive early 20th-century streetcar system.

Amtrak Cutting Jobs, Funding to High-Speed Rail
The agency plans to cut 10 percent of its workforce and has confirmed it will not fund new high-speed rail projects.

Ohio Forces Data Centers to Prepay for Power
Utilities are calling on states to hold data center operators responsible for new energy demands to prevent leaving consumers on the hook for their bills.

MARTA CEO Steps Down Amid Citizenship Concerns
MARTA’s board announced Thursday that its chief, who is from Canada, is resigning due to questions about his immigration status.

Silicon Valley ‘Bike Superhighway’ Awarded $14M State Grant
A Caltrans grant brings the 10-mile Central Bikeway project connecting Santa Clara and East San Jose closer to fruition.
Urban Design for Planners 1: Software Tools
This six-course series explores essential urban design concepts using open source software and equips planners with the tools they need to participate fully in the urban design process.
Planning for Universal Design
Learn the tools for implementing Universal Design in planning regulations.
Caltrans
City of Fort Worth
Mpact (founded as Rail~Volution)
City of Camden Redevelopment Agency
City of Astoria
City of Portland
City of Laramie