


Demographia's International Housing Affordability Surveys are widely used to compare cities and evaluate urban development policies, but there are good reasons to question their analysis methods, starting with their definition of "house."


Demographia's International Housing Affordability Surveys are widely cited in popular media and used by planning professionals to compare cities' housing affordability and evaluate urban development policies. This is not surprising since they are the only freely-available surveys of their type.
These surveys are part of Demographia’s political agenda to support land use policies that favor lower-density urban fringe development. Their main conclusion is that smart growth policies that encourage compact development are the main constraint on housing affordability. There are good reasons to question both the surveys' methodologies and conclusions.
The surveys rate housing affordability by calculating the Median Multiple, the ratio of median house sales prices and median household incomes for metropolitan regions (cities and their suburbs). The results depend significantly on the definition of “house.”
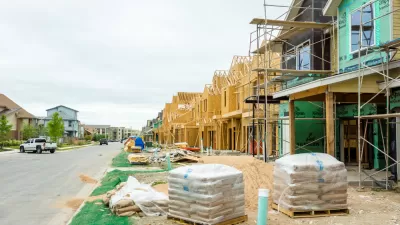
In many cities, a major portion of owner-occupied homes are multi-family: duplexes, townhouses and apartments (condominiums). Does the analysis give these weight relative to their market share, or are the house price data biased toward single-family houses? This is a critical question, particularly in large, growing cities with geographic constraints (either physical or political) where land unit costs (dollars per acre) are high, making land-intensive housing types (i.e., single-family) less affordable relative to land-efficient housing (i.e., multi-family).
The survey does not really specify. It simply explains that, “Median house price information is obtained from the leading national reporting agencies and includes the housing stock as reported upon.” It then lists various government agencies and real estate professional organizations which supplied data. The report uses a banner (below) of seven houses, six of which are single-family, four of which have driveways and garages, suggesting that authors Wendell Cox and Hugh Pavletich assume that “house” refers primarily to larger-lot, single-family homes.

These surveys are not peer reviewed (few of Cox’s publications are), nor are the data posted anywhere for other researchers to examine. Such reviews and data transparency are common practice among serious researchers, and are the basis for reliable and objective scientific analysis. During the last month I twice emailed the report's authors asking them to clarify these details and provide examples of their data. They have not responded.
This is not the first time that I've challenged Cox's analysis methods. A few years ago he criticized my study, Rail Transit In America, which used national Consumer Expenditure Survey data to show that residents of communities with high quality public transit spend a smaller portion of their incomes on transportation than residents of more automobile-dependent communities, a finding that was subsequently validated by other research. Cox claimed that his analysis indicated otherwise, but it relied on the ACCRA Cost of Living Index, which measures expenditures by high-income households and so does not really reflect affordability as it is usually defined. Cox never mentions this detail, which I consider a significant omission.
Let me be specific. The Metropolitan Statistical Area Consumer Expenditure Tables indicates that in 2006 (my study year) the portion of household income spent on transportation was much lower in compact, transit-oriented regions (New York 10.9%, Boston 10.8%, Washington DC 9.5%) than in sprawled, automobile-dependent regions (Houston 15.6%, Dallas 16.0%, and Phoenix 18.3%). Similarly, researchers Reid Ewing and Shima Hamidi recent analysis of 221 U.S. metropolitan areas and 994 counties found that each 10% increase in their Compactness Index is associated with a 3.5% decrease in transport costs relative to income, which is much larger than the 1.1% increase in housing costs relative to income. In addition, numerous Location Efficiency studies indicate that combined housing and transportation costs are lower in more compact, multi-modal neighborhoods. Since lower-income households tend to own fewer vehicles and rely more on affordable modes than higher income households, such saving are probably particularly large for lower-income households. Yet, Cox claims that these relationships are unproven or irrelevant; that housing affordability should be considered without regard to transport affordability and that total impacts can be evaluated based on high-income household's consumption patterns.
There are also good reasons to challenge many of the Housing Affordability Index report's conclusions.
First, it is inappropriate to evaluate affordability based only on housing costs; most experts now recommend measuring it based on combined housing and transportation expenses in recognition that households often face trade-offs between these costs. A house is not truly affordable if its location significantly increases transportation costs, including money, time and health risks. Good public policies therefore emphasize Affordable-Accessible Housing, which refers to lower-priced housing in accessible, multi-modal neighborhoods.
Second, it is wrong to assume, as Smart Growth Critics often do, that urban containment policies are the main cause of housing inaffordability. Yes, constrains on urban expansion drive up land unit costs (dollars per acre), but this can be offset if housing policies allow more compact, land-efficient housing types, for example, shifts from large-lot (1 acre) to small-lot (1/10 acre) single-family; townhouses (1/20 acre); low-rise (1/40 acre); or high-rise (1/80 acres) housing types. As a result, policies that favor compact development only cause housing unaffordability if implemented in conjunction with density-limiting policies such as restrictions on building heights, floor area ratios and multi-family housing, and minimum parking supply and setback requirements.
Cox assumes that urban fringe housing is a perfect substitute for urban center housing, ignoring many people's preference to live close to urban services and activities, and the large incremental transportation costs of exurban locations. Smart growth advocates argue that the best way to achieve true affordability is to remove impediments to compact infill development. To illustrate the two perspectives, first read Wendell Cox's recent column, Thomas Sowell Explains The Economics Of Urban Containment (Smart Growth), which argues, without evidence, that San Francisco's high housing costs are fully explained by the region's urban containment policies, then read Kyle Russel's column, This One Intersection Explains Why Housing Is So Expensive In San Francisco, which provides a more nuanced analysis and uses terrific maps to show that most of San Francisco has a 40-foot building height limit; a policy that severely reduces new housing supply and therefore affordability.
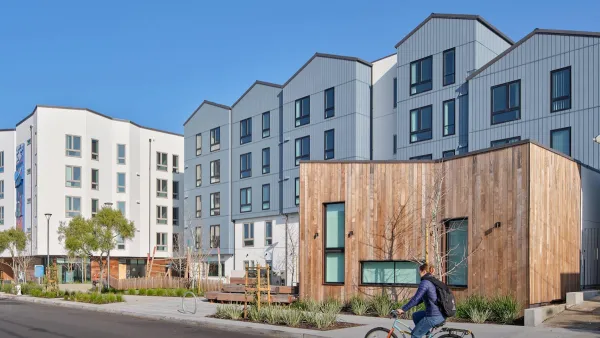
Third, I suspect that Cox and Pavletich are applying their own personal preferences for single-family homes to their policy analysis. Yes, many people like single-family homes, at least during part of their life, particularly households with young children, but surveys indicate that many will accept more compact housing options in exchange for financial savings or other amenities, and families with young children are a declining portion of total households. In developed countries such as the US, Canada and Australia, there is a large existing supply of large-lot single-family housing; various market studies suggest that most of the growth in housing demand will be for more compact housing types in accessible, multi-modal neighborhoods. Responding to future consumer demands therefore requires allowing more compact, infill housing types in walkable and transit-oriented neighborhoods, in order to increase supply and reduce prices of such housing.
Fourth, the authors provide almost no analysis concerning how specific policies affect housing affordability, what specific policy changes they they recommend, and the costs of those reforms. The table below identifies various factors that affect housing affordability, of which land unit costs are just one. This can help expand the scope of potential affordability strategies. For example, if Cox and Pavletich are truly concerned about affordability they would champion eliminating minimum parking requirements which have proven to significantly increase housing prices at the lower end of the market, remove barriers to affordable urban housing development, and they would be concerned about transportation as well as housing costs.
Factors Affecting Housing Affordability
|
Factor |
Description |
Impacts on Housing Affordability |
|
Land supply and price |
Amount of land available for residential development, and therefore residential land unit prices (per acre or hectare). |
Limited land supply tends to increase land unit prices which increases housing costs in proportion to land required per housing unit (i.e., reduces affordability of larger-lot housing) |
|
Housing density |
Land required per housing unit. |
Increased density reduces land costs per housing unit. |
|
Development and construction costs |
The costs (fees, construction, financing) of building new housing, or improving dilapidated housing. |
Lower development costs increase housing affordability. |
|
Existing housing stock |
Amount of existing lower-price housing. |
An abundant supply of older, less desirable housing tends to increase housing affordability. |
|
Location attractiveness |
Whether a neighborhood or city is relatively attractive and therefore commands a price premium. |
More attractive locations have higher prices which reduces affordability. |
|
Access and transport costs |
Ease of reaching desired destinations, and the quality of affordable transport options (walking, cycling and public transit), and therefore transport costs. |
More accessible are more valuable, and areas with more affordable travel options have lower transportation costs which leaves households with more money to spend on housing. Housing will seem less affordable, although housing and transportation may be more affordable overall, in more accessible and multi-modal locations. |
|
Population growth |
Rate of new residents. |
Higher population growth may reduce housing affordability if house construction costs (including land, development and construction) are high. |
|
Investment potential |
Perception that housing investments provide relatively high or safe profits. |
High investment potential will tend to increase housing prices and reduce affordability. |
Various factors can affect housing affordability.
Research discussed in my recent column, More Great Research Quantifying Smart Growth Benefits, points out that, although more compact development is associated with reduced housing affordability (housing costs as a portion of average household incomes), it increases transport affordability, public safety and health, upward economic mobility and environmental quality. All of these factors should be considered in order to identify truly optimal policies; the Housing Affordability Surveys ignore these issues.
* * *
Wendell Cox and Hugh Pavletich, please respond to this column: provide specific information on how you define and measure house prices, and make your data available for independent review. This will allow planning professionals and policy makers to have confidence in your analysis. Such clarity, transparency and independent peer review are the hallmarks of good research.
For More Information
AARP (2008), Opportunities for Creating Livable Communities, Research Report, American Association for Retired Persons Public Policy Institute.
Affordable Housing Resource Center.
Ben Brown (2012), Dream Home For The New Era: Compact, Connected & Mortgage-Free, Better Cities.
CNT (2013), The New Real Estate Mantra: Location Near Public Transportation, Center for Neighborhood Technology, American Public Transportation Association, National Association of Realtors.
Ali A. Isalou, Todd Litman and Behzad Shahmoradi (2014), “Testing The Housing And Transportation Affordability Index In A Developing World Context: A Sustainability Comparison Of Central And Suburban Districts In Qom, Iran," Transport Policy, Vol. 33, May pp. 33-39.
Louise Keely, Bart van Ark, Gad Levanon and Jeremy Burbank (2012), The Shifting Nature of U.S. Housing Demand, The Demand Institute.
Jonathan Levine, Aseem Inam, Richard Werbel and Gwo-Wei Torng (2005), “A Choice-Based Rationale for Land Use and Transportation Alternatives,” Journal of Planning Education and Research, Vol. 24, No. 3, pp. 317-330.
Todd Litman (2012), Where We Want To Be: Home Location Preferences And Their Implications For Smart Growth, Victoria Transport Policy Institute.
Todd Litman (2013), Affordable-Accessible Housing In A Dynamic City: Why and How To Support Development of More Affordable Housing In Accessible Locations, Victoria Transport Policy Institute.
Mixed-Income Transit-Oriented Development Action Guide, developed by the Center for Transit-Oriented Development, is a comprehensive website providing information on ways to create mixed-income housing in transit-oriented development.
Arthur C. Nelson (2014), The New California Dream: How Demographic and Economic Trends May Shape the Housing Market, Urban Land Institute.
Gary Pivo (2013), The Effect Of Transportation, Location, And Affordability Related Sustainability Features On Mortgage Default Prediction And Risk In Multifamily Rental Housing, University of Arizona for Fannie Mae.
Robert Steuteville (2011), Housing: An Irresistible Force Meets An Immovable Object. Rental And Transit-Oriented Development Will Dominate Market Demand For The Next Decade, But Will Public Officials Provide The Right Framework?, New Urban Network.
Robert W. Wassmer and Michelle C. Baass (2006), “Does a More Centralized Urban Form Raise Housing Prices,” Journal of Policy Analysis and Management, Vol. 25, No. 2, pp. 439-462.


Upzoning Affordability Impacts: The Latest Research
There are new controversies concerning how upzoning affects housing supply and affordability, and new research to help planners understand these issues.
The Housing Affordability Recipe
Smart policies can ensure that low- and moderate-income households can find suitable housing in good neighborhoods where transportation costs are low. The research is clear: upzoning works.

Defining the Buzzword: What's a 15-Minute City?
What does it mean to be a 15-minute city?

Planetizen Federal Action Tracker
A weekly monitor of how Trump’s orders and actions are impacting planners and planning in America.
San Francisco's School District Spent $105M To Build Affordable Housing for Teachers — And That's Just the Beginning
SFUSD joins a growing list of school districts using their land holdings to address housing affordability challenges faced by their own employees.

The Tiny, Adorable $7,000 Car Turning Japan Onto EVs
The single seat Mibot charges from a regular plug as quickly as an iPad, and is about half the price of an average EV.

With Protected Lanes, 460% More People Commute by Bike
For those needing more ammo, more data proving what we already knew is here.

In More Metros Than You’d Think, Suburbs are Now More Expensive Than the City
If you're moving to the burbs to save on square footage, data shows you should think again.

The States Losing Rural Delivery Rooms at an Alarming Pace
In some states, as few as 9% of rural hospitals still deliver babies. As a result, rising pre-term births, no adequate pre-term care and "harrowing" close calls are a growing reality.
Urban Design for Planners 1: Software Tools
This six-course series explores essential urban design concepts using open source software and equips planners with the tools they need to participate fully in the urban design process.
Planning for Universal Design
Learn the tools for implementing Universal Design in planning regulations.
Smith Gee Studio
City of Charlotte
City of Camden Redevelopment Agency
City of Astoria
Transportation Research & Education Center (TREC) at Portland State University
US High Speed Rail Association
City of Camden Redevelopment Agency
Municipality of Princeton (NJ)