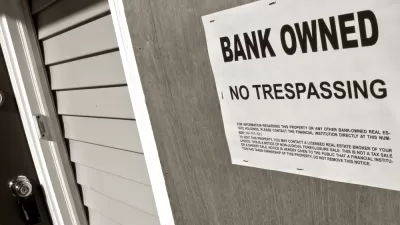
A new visualization tool by the Urban Institute provides a vivid portrait of an unfortunate truth: the foreclosure crisis and other effects of the Great Recession real estate market were worse for minority groups.
"African Americans and Hispanics are still feeling the pain of the housing bust, and they’re feeling it more acutely than white Americans, even all these years later," reports Dina ElBoghdady.
That news comes from a series of interactive maps created by the Urban Institute to "show the distribution of 100 million mortgages originated from 2001 through 2012, broken down by race and ethnicity."
"The maps chronicle what many researchers have already said: Loans to Hispanics and African Americans shot up dramatically when the housing market was red hot and credit came easy, in part because minorities were targeted by predatory lenders. When the housing market unraveled, these groups were positioned to be hit hardest by foreclosures, and they were."
The article goes on to take a closer look at the trend in several major metropolitan areas (namely, San Francisco, Detroit, Miami, and Washington D.C.).
FULL STORY: A look at who did (and didn’t) get mortgages in the boom, bust and after

Maui's Vacation Rental Debate Turns Ugly
Verbal attacks, misinformation campaigns and fistfights plague a high-stakes debate to convert thousands of vacation rentals into long-term housing.

Planetizen Federal Action Tracker
A weekly monitor of how Trump’s orders and actions are impacting planners and planning in America.

In Urban Planning, AI Prompting Could be the New Design Thinking
Creativity has long been key to great urban design. What if we see AI as our new creative partner?

King County Supportive Housing Program Offers Hope for Unhoused Residents
The county is taking a ‘Housing First’ approach that prioritizes getting people into housing, then offering wraparound supportive services.

Researchers Use AI to Get Clearer Picture of US Housing
Analysts are using artificial intelligence to supercharge their research by allowing them to comb through data faster. Though these AI tools can be error prone, they save time and housing researchers are optimistic about the future.

Making Shared Micromobility More Inclusive
Cities and shared mobility system operators can do more to include people with disabilities in planning and operations, per a new report.
Urban Design for Planners 1: Software Tools
This six-course series explores essential urban design concepts using open source software and equips planners with the tools they need to participate fully in the urban design process.
Planning for Universal Design
Learn the tools for implementing Universal Design in planning regulations.
planning NEXT
Appalachian Highlands Housing Partners
Mpact (founded as Rail~Volution)
City of Camden Redevelopment Agency
City of Astoria
City of Portland
City of Laramie


