


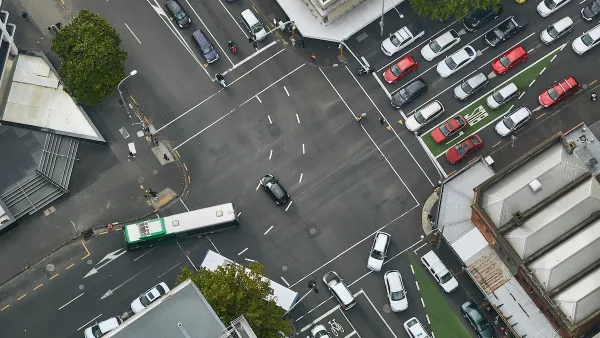
Hannah Fairfield charts two variables - miles traveled versus deaths per 100,000 population - over the last 60+ years, and notes key technological or behavioral breakthroughs, to offer unique insight into advancements in driving safety.
While still the top killer of Americans aged 5 to 34, traffic accidents have been steadily declining for the last several decades. Even as vehicle miles driven per capita has steadily increased, regular advances in technology, new government policies, and changes in driving behavior brought on by cultural forces have been able to significantly reduce the rate of auto fatalities since the peak of the late 1960s and early 1970s.
Fairfield charts this progress by plotting miles traveled against deaths per 100,000 population and finds "a pattern that looks like a plateau followed by a steep drop. It evokes the theory of punctuated equilibrium, proposed by the paleontologists Stephen Jay Gould and Niles Eldredge, which suggests that instead of continuous gradual evolution, change occurs abruptly
after periods of virtual standstill."
"You see fatalities drop after a breakthrough in new technologies or behaviors, and then plateau until the next one," said David L. Strickland, administrator of the National Highway Traffic Safety Administration. "It takes time for new safety technologies to work their way into the whole fleet of cars on the road."
FULL STORY: Driving Safety, in Fits and Starts


Let’s End Traffic Stops
The technology to make traffic enforcement obsolete is becoming available. But in the U.S. willing to use it?
How Understanding Near-Misses Can Improve Road Safety
Most road safety efforts are based on data about crashes that have already occurred. But important information can be gleaned from incidents when something almost went wrong, but didn’t.
Vehicle-related Deaths Drop 29% in Richmond, VA
The seventh year of the city's Vision Zero strategy also cut the number of people killed in alcohol-related crashes by half.

Planetizen Federal Action Tracker
A weekly monitor of how Trump’s orders and actions are impacting planners and planning in America.
Vehicle-related Deaths Drop 29% in Richmond, VA
The seventh year of the city's Vision Zero strategy also cut the number of people killed in alcohol-related crashes by half.
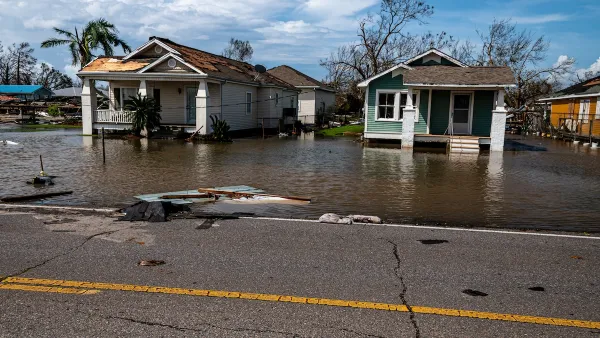
As Trump Phases Out FEMA, Is It Time to Flee the Floodplains?
With less federal funding available for disaster relief efforts, the need to relocate at-risk communities is more urgent than ever.

Data: In Rural America, Mobile Homes are Heat Traps
Extreme heat is often viewed as an urban problem, but rural communities face their own unique risks.

NYC: What Mamdani’s Rivals Can Teach Him About Transportation
The mayoral candidate won on a bold, progressive platform. Some of his opponents had even bolder ideas.

Berkeley Approves ‘Middle Housing’ Ordinance
The city that invented single-family zoning is finally reckoning with its history of exclusion.
Urban Design for Planners 1: Software Tools
This six-course series explores essential urban design concepts using open source software and equips planners with the tools they need to participate fully in the urban design process.
Planning for Universal Design
Learn the tools for implementing Universal Design in planning regulations.
Heyer Gruel & Associates PA
JM Goldson LLC
Custer County Colorado
City of Camden Redevelopment Agency
City of Astoria
Transportation Research & Education Center (TREC) at Portland State University
Camden Redevelopment Agency
City of Claremont
Municipality of Princeton (NJ)