


Driving makes people fatter and less healthy, right? Fanis Grammenos warns planners and urban designers that the answer is not so simple, and misusing the statistics will weaken effective debate.

Discussions about the negative influences of car travel as the dominant mode of mobility regularly include its potential detrimental health effects. One example is the association that was recently made between car travel and the lower average healthy life expectancy (DFLE) (by 1.5 years) of US citizens versus their OECD counterparts. The author cautioned us, however, that "...this is a pretty crude analysis" and encouraged "...anybody with the skills and time to develop a better model."
In this vein, and being neither a statistician nor a specialist, I offer a few thoughts that may help refine the analysis or shift its direction.
A short preamble first: Most seasoned researchers acknowledge that stats can almost always provide evidence for what we wish to be true. This is particularly true in social sciences, such as the case at hand. Inadvertently, even with all their mathematical rigour, stats often conceal as much as they reveal (a fact unintentionally made unintelligible in the "study limitations" sections).
To expand the horizon of the health-travel conversation, I explore additional statistics that I believe need to be assimilated into it. These may reveal the multiplicity of factors and their interactions and raise questions about misapplied correlations and improbable causalities. This article does not aim to deny the merit of proposing policies to increase active travel (a worthwhile goal) but seeks to limit the license to use statistics incautiously to prove their value. A first step in that direction is to question the appropriateness of longevity (or disability-free life expectancy) as an indicator.
Longevity and motorization in the US
Life expectancy in the US has risen constantly in the automotive 20th century from 49.2 in 1900 to 77.5 years in 2003 or, simply put, 28 years were added to 50; a stunning cultural achievement. The same is true for Canada where 31 years were added to 49 since 1901. For a century dominated by motorized transport, which in its early decades caused a virtual slaughter on city streets and, without catalytic converters until the late 70s (combined with a very inefficient fleet), produced a very noxious, toxic environment, this upward trend is counter-intuitive. Such a trend raises the question of the exact role automobiles plays in the loss of life-years.
The first fifty years of auto-mobility, however bad they might have been, are not typical of a general lifestyle that relies predominantly on cars for transport and they could be sidestepped as unrepresentative. The true motorization of daily life took hold from the 50s on, the Interstate Highway era, with the expansion of cities into vast first and second tier suburbs.
A comparison of VMTs and longevity for the 2nd half of the 20th century also shows a fairly good correlation. In these 50 years, the per capita VMTs in the US rose from about 3,000 miles in 1950 to about 9,000 miles in 2000, an astonishing 300% percent increase. Yet, during the same period 7.4 years were added to the average lifespan of US citizens. Are we to conclude from these figures that motorization aided longevity? Surely not, based just on one covariance. We don't know in what ways auto-mobility could mediate a life-span increase, except by the mundane and likely insignificant fact of speedier access to hospitals for accident victims and heart or stroke patients. Another speculative connection, supported by research, is the opportunity it provides for frequent visits to the countryside, a confirmed de-stressor. Cottages, for example, a cherished possession of about 10% of households, would be entirely inaccessible on weekends or other occasions without auto-mobility. The same holds true for pristine and remote National Reserve sites. Abundant research has shown a correlation between proximity to nature and better population health, but we don't know whether cottage owners or frequent hikers fair better than others. Consequently, lacking the list and the data on the mediating mechanisms, the question of a potential positive influence of auto-mobility and its magnitude remains unanswered for now. And, based on the simple countervailing evidence, neither can we assert that this dramatic three-fold increase in VMTs had a calamitous effect on health or longevity.
Zooming in on mechanisms
On the negative influence side, we can at least speculate on the possible mechanisms (Chart 1). Eight health problems are associated with inadequate physical activity, of which driving is one. Of these eight, heart and cerebrovascular diseases have decreased dramatically in the US (down by roughly two thirds since 1950), though they still remain as principal causes. Cancers, of which there are many types and have many, and unknown, potential causes (including a chemical overload in foods, drinks and air), have remained practically unchanged. Diabetes returned to the 1950s level after a drop in the 80s. Respiratory diseases have increased and air pollution could be a partial cause for the increase. (Personal driving, however, is but one contributor to air pollution, at about 60% of the total emissions attributed to transport, which is responsible for about 27.3 % of emissions from all sources; this translates to about 17% of the total.)
The fifth, and direct, cause of life loss, accidents, also declined substantially. In the US fatalities fell from 15.91 to 11.01 per 100,000 people between 1994 and 2009; a 42% decrease in a slow but continuing trend. In Canada, absolute fatalities dropped from about 3,200 in 1996 to 2,200 by 2009; down by 32 percent in 14 years even though car numbers and VKTs continued to increase.

Are we to conclude from these downward trends in disease progression and fatalities that a 300% increase in auto-mobility has no significant impact in aggravating the causes of death? Or, if it did, speculate that other countervailing factors mask the effect?
Until we fully understand the mechanisms of the onset of these diseases and the precise attribution to factors that trigger their emergence, the jury on how auto-mobility modifies lifespan, whether negatively or positively and to what net extent, is still out.
Of the mechanisms, we know that obesity, an early sign of possible negative health outcomes, can have several triggers acting singly or in concert. One is a sedentary lifestyle and a second is diet. Physically passive tasks include driving but also sedentary work, pastimes and hobbies. Driving has been shown to correlate with the odds of obesity increase as have lack of exercise, education, stress, and food amount and type. Note that the fifties, the highway era, also saw the widespread adoption of television soon to become the key media for communication, politics, advertizing and free entertainment, inducing more passivity at home. The same era also saw an exponential growth of fast food chains that paid little attention to dietary rules. These covariances in cultural traits also imply a respective increase in the probable triggers of obesity aside from and in addition to driving. The exact contribution of each remains undetermined.
On the job scene, during these fifty years, the service sector overtook the production sector in employment. More jobs became office desk jobs, while others increasingly involved more driving (e.g. salespersons, school-bus drivers, pizza delivery etc). Studies show significantly increased odds of obesity among office workers. Increased odds also correlate well with lower education levels and rise dramatically with stress-induced overeating. Diet has been shown as a key element in the maintenance of a healthy weight. The Japanese for example, have a very low obesity rate (3.2% in 2003) and are said to owe their highest longevity (81.8 years in 2002) among nations partly to eating predominantly fish instead of red meat. Curiously, just after the war, the same normal-weight Japanese had one of the lowest life expectancies in the world a fact that excludes genetic influences and makes the negative impact of increased auto-mobility, which occurred mostly after the war, a moot point.
If obesity can be shown to correlate well with life expectancy, deciphering the relative magnitude of impact of each of its triggers can help rationalise and prioritize policy responses. Focusing exclusively or predominantly on driving may sidestep great opportunities for speedy, effective action. However, if Chart 2 were taken at face value, only a tenuous correlation, if any, between obesity and life expectancy can be construed. Other factors may be at work that require a closer look.
The curious case of Denmark
The logic goes that if we walk and bike more and use public transport we should expect to live, on average, longer and healthier lives. As it happens, we can test this hypothesis with a real life example, an OECD member, Denmark. Of fifteen EU nations ( Chart 2), Denmark had the second lowest car ownership rates in 2004 (354 per 1000), had the highest walking share of trips, the second highest bicycling rate (18% in 2003) the fourth lowest obesity rate at 11.4% (2008) and a below average fatal accident rate (at 7 victims per 100k pp in 2005). Yet, in 2006, Denmark's life expectancy was the lowest among the fifteen and identical to the the US' (at 77.8years), where active modes of transport are insignificant and obesity rates are about three times (33.8% in 2008) the Danish. Clearly factors other than travel mode choice must be at work.
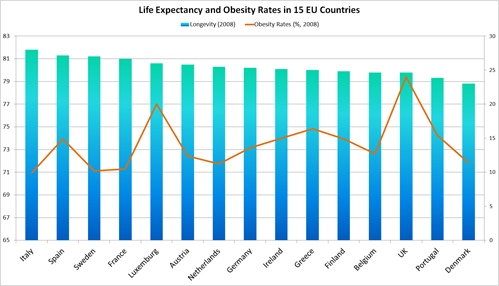
The second leader in walking, bicycling and transit use, Netherlands, fairs no better than average; 1.5 years lower than Italy (which has the second highest car ownership after Luxemburg), an average walking share and third lowest bicycling share (at 3%) and with an obesity rate in the same range.
The converse relationship does not bear out either. Greece ranking fourth in obesity(18.1% in 2008), about 50% higher than Denmark, with the lowest car ownership rate, lowest level of walking among fifteen EU countries and by far the highest fatal accident rate, had an average lifespan of 79.2 or 1.4 years higher than the walking/biking Denmark and the compulsive-driving US. Similarly, the UK showing more than twice Denmark's obesity rate has a higher life expectancy by a whole year. Data from two other industrialized countries that are highly motorized add more complexity to the puzzle of presumed correlations. Australia and Canada had an 81.5 and 80.9 years of life expectancy in 2008, respectively; a 2.5 year difference from US and Denmark. (Canada obesity rate was 23.1% in 2004, twice that of Denmark).
Can we conclude from these inconsistent and contradictory figures that a correlation exists between level of active transportation, and life expectancy?
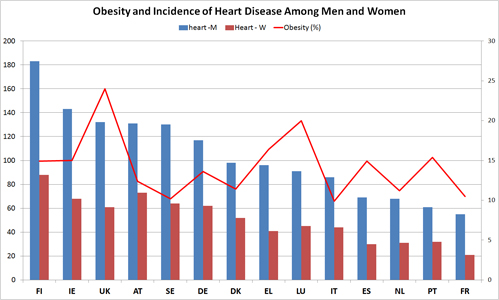
A similarly thorny line of reasoning supposes that the action path of more driving in reducing life years is via engendering obesity which in turn leads to chronic diseases. Charts 3 and 4 undermine the driving-to-obesity-to-disease path by furnishing statistics on the incidence of diabetes and heart disease.
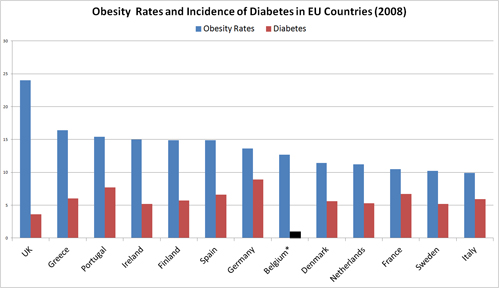
Chart 3 shows no correlation between rates of obesity and incidence of diabetes. UK with the highest rate of obesity shows the lowest incidence of diabetes and conversely the least obese nation, Italy, at less than half the UK rate shows almost double the incidence of diabetes. Germany with an average obesity rate has the highest incidence of diabetes. Denmark and the Netherlands, the nations with the highest levels of active transport do not vary significantly from the average incidence (6.0), contrary to what might be expected. Clearly, other, unknown mediating factors between obesity and diabetes and, consequently, between driving and diabetes are at work. For heart disease, chart 4 also shows hard to reconcile variances. The spikes and troughs of variations in obesity are not mirrored in the corresponding disease incidence.
The Denmark example would be disquieting, if we took the longevity indicator at face value. It would mean that, if the US were to achieve Denmark's levels of active transportation, a task that might take several generations of policy implementation, it may arrive at square one of the longevity track. Clearly, longevity seems a poor indicator of the effectiveness of active transport in improving health. We need an alternative, or many.
Troubling trends
Another conundrum to ponder is the trends in car ownership, mode share and obesity in countries that are leading the way in active transportation. In the two top bicycle/walk users Netherlands and Denmark, car ownership rose by 215% and 178% respectively over 35 years (1970 to 2005). In the same period, US car ownership rose by 190%, a similar range, though starting at a higher point. Between 1952 and 2005, Netherlands saw their Bike Kilometres Travelled (BKTs) drop by almost half (but still leading Europe). Britain's BKTs dropped by an astonishing 80 percent in that same period. Netherlands and Denmark saw their obesity rate double since 1988 and the same is true for Sweden (yet another leader in walking and biking). These trends are both surprising and disquieting: when people who have experienced the benefits of an active lifestyle abandon it in increasing numbers, the prospects dim for everyone.
Is the rise in obesity in these leading countries caused by increased auto-mobility? We would need a very sophisticated analysis to isolate its influence. Are these nations heading in the NA direction while NA is attempting to emulate their highest achievements? A perplexing question worth investigating in detail.
Getting to the fine grain differences
If we can't explain these incongruities, there are other potential correlations that beg for our attention, interpretation and, possibly, choice of interventions. For example, differences in life expectancy among States and races.
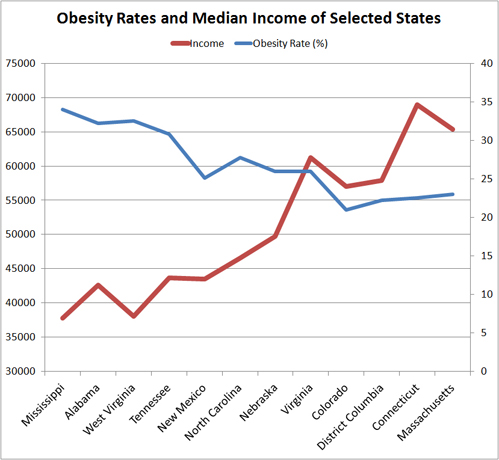
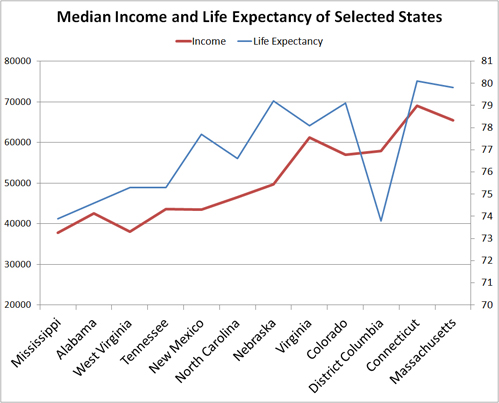
Chart 5 shows a fairly good correlation between income and life expectancy among specific states that were chosen to cover the gamut of recent obesity ratings from highest to lowest. Yet income by itself does not explain disease; its effect must be deciphered in terms of its mediating role.
A recent UK study in the Marmot Review found a 9-year life expectancy and a 16 year DFLE difference between the least and the most deprived citizens. A Canadian Study found a difference in life expectancy between the highest and lowest income quintiles of 6 years for men and 3 years for women. Digging deeper, the research identified one psychological/ biological mediating mechanism – the sense of control of one's life circumstances. Having less control (choice, options), that comes with lower income, increases stress and weakens the immune system with the consequence that disease finds an easy target.
Chart 6 shows that as incomes rise obesity rates tend to fall, a seemingly counterintuitive trend: a) lower income could well mean less food on the table and b) more manual, low-paid jobs, therefore more calorific expenditure. However, lower income could also imply higher unemployment rates, therefore increased average sedentary life and also increased stress. It can also mean a poor diet regime with predominantly inexpensive but unhealthy foods. Note that the lower incomes and higher obesity rates occur in the southern states where African-Americans form a significant proportion of the population; though still a minority (one region where they form a majority is the District of Columbia, the outlier in chart 5). There has been a constant gap in unemployment between whites and blacks that fluctuated between 5 and 10 percent in the last 30 years. In 2003 African-Americans maintained a persistent life expectancy difference of 6.3 years.
Compiled statistics break down the overall race difference to specific disparities in ailments such as a 34% difference in Cardiovascular diseases, followed by a 21.1% difference in infections, and a 10.7% difference in trauma. These are substantial differences. It seems that, as the picture becomes more fine-grained, it becomes harder to ascertain whether the entire 6.3 year racial disparity or a certain (unknown) portion of it can be attributed to driving.
The puzzle of childhood obesity
While driving to work or shopping could be a contributing factor to adult obesity, its role may be less clear among children. The US CDC reports that obesity has tripled among children between the ages of 6 and 11 in the last 30 years and has gone from 5% to 18.1% among children of 12 to 19 years of age. These young people, who are not drivers, will soon merge into the adult population seeking an explanation for their handicap. A detailed analysis is needed to accommodate this data into the driving-to-obesity hypothesis.
Conclusion
Predictably, and also inevitably, I used statistics to question conclusions drawn from other statistics and to, hopefully, expose a web of complex relations.
We started with the 1.5 year difference in average DFLE between the US and OECD countries and ended up with a conundrum about the meaning of many differences: Differences among states in the US, the race difference, differences among EU countries, the curious puzzles of US versus Denmark, Denmark and Greece, Denmark and two OECD more auto-dependent nations. We also saw the many faces of obesity and the influence of income, education, job type, sedentary lifestyle, diet and stress could have in triggering it. In addition, we saw obesity being just one of many potential contributors to life threatening ailments.
Each study that looks at specific obesity-generating triggers recommends policies to combat them. Consequently, there is a plethora of potential action plans. Each begs the question of effectiveness, time span and, inevitably, cost efficiency. Few attempts have been made at these questions.
Given these intriguing disparities and unsolved puzzles, the question of meaningful correlations between auto-mobility and health remains wide open to finer-grain investigations. The challenge of effective interventions is formidable and pressing. Caution in using the Procrustean bed of statistics is clearly warranted; many hypotheses died on it.
Fanis Grammenos is a principal of Urban Pattern Associates and was a Senior Researcher at Canada Mortgage and Housing Corporation for over 20 years. He focused on housing affordability, building adaptability, municipal regulations, sustainable development and, recently, on street network patterns. Prior to that he was a housing developer. He holds a degree in Architecture from the U of Waterloo.
- CRS Report for Congress Life Expectancy in the United States Updated August 16, 2006
- Laura B. Shrestha, Specialist in Demography, Domestic Social Policy Division, Table 705. Household Income--Distribution by Income Level and State: 2008Source: U.S. Census Bureau, 2008 American Community Survey; B19001, "Household Income in the Past 12 Months" and B19013, "Median Household Income in the Past 12 Months (In 2008 Inflation-Adjusted Dollars)," accessed January 2010.
- OECD (2010), Health at a Glance: Europe 2010, OECD Publishing. http://dx.doi.org/10.1787/health_glance-2010-en
- David R. Bassett, Jr., John Pucher, Ralph Buehler, Dixie L. Thompson, and Scott E. Crouter,2008 Walking, Cycling, and Obesity Rates in Europe, North America, and Australia, Human Kinetics.
- Cynthia L. Ogden, Ph.D., and Margaret D. Carroll, M.S.P.H., Division of Health and Nutrition Examination Surveys: Prevalence of Overweight, Obesity, and Extreme Obesity Among Adults: United States, Trends 1960–1962 Through 2007–2008


The Shifting Demographics of Covid-19
For most of the Covid-19 pandemic, Black Americans died at much higher rates than White Americans. That trend has reversed at times during the past year.

Obesity Tied to Suburban Life
London-based study ties obesity to sprawl and finds that suburbs have a bigger obesity problem than rural areas.

Study Touts the Public Health Benefits of Dense, Urban Living
A study of British cities find people living in dense urban cores are less likely to struggle with obesity and more likely to exercise—signs of higher quality of life—than their counterparts in suburban environments.

Planetizen Federal Action Tracker
A weekly monitor of how Trump’s orders and actions are impacting planners and planning in America.

Maui's Vacation Rental Debate Turns Ugly
Verbal attacks, misinformation campaigns and fistfights plague a high-stakes debate to convert thousands of vacation rentals into long-term housing.

San Francisco Suspends Traffic Calming Amidst Record Deaths
Citing “a challenging fiscal landscape,” the city will cease the program on the heels of 42 traffic deaths, including 24 pedestrians.

Amtrak Rolls Out New Orleans to Alabama “Mardi Gras” Train
The new service will operate morning and evening departures between Mobile and New Orleans.

The Subversive Car-Free Guide to Trump's Great American Road Trip
Car-free ways to access Chicagoland’s best tourist attractions.

San Antonio and Austin are Fusing Into one Massive Megaregion
The region spanning the two central Texas cities is growing fast, posing challenges for local infrastructure and water supplies.
Urban Design for Planners 1: Software Tools
This six-course series explores essential urban design concepts using open source software and equips planners with the tools they need to participate fully in the urban design process.
Planning for Universal Design
Learn the tools for implementing Universal Design in planning regulations.
Heyer Gruel & Associates PA
JM Goldson LLC
Custer County Colorado
City of Camden Redevelopment Agency
City of Astoria
Transportation Research & Education Center (TREC) at Portland State University
Jefferson Parish Government
Camden Redevelopment Agency
City of Claremont