The Center for an Urban Future found that ridership in the greater Manhattan area has been up significantly since 1998. But these routes are precisely the ones targeted for service cuts due to decreased revenue.


Our analysis, based on data from MTA New York City Transit, show just how important the city's public transportation system has become for residents living outside the city center:
• 20 of the 22 stations with the largest percentage increase in subway ridership were either in the outer boroughs or in Manhattan north of 96th Street.
• In 2008, 62 stations outside of Manhattan had an average weekday ridership of over 10,000 people, up significantly from 46 stations in 2003 and 36 in 1998.
• More than a quarter of all New York City subway stations-111 out of 425-saw an increase in average weekday ridership of 50 percent or more during the past decade. Brooklyn accounted for nearly half (51) of those stations; there were 28 in Manhattan, 20 in the Bronx and 12 in Queens.
• 13 stations on the L line and nine on the N line were among the 50 fastest growing stations citywide. Other lines with several stations on the top-50 list: the 2 (seven stations), 3 (six stations), F (five stations), J (five stations) and M (five stations).
The growth in outer-borough bus ridership, meanwhile, dwarfed Manhattan's during the same period. Overall, 81.7 percent of the gain in bus riders occurred outside Manhattan. Queens experienced a 28.4 percent increase; Brooklyn a 21.9 percent increase; the Bronx a 23.5 percent increase and Staten Island a 28.4 percent increase. By contrast, Manhattan's bus ridership grew by only 7.6 percent since 1998. (It actually experienced a 6.7 percent decrease between 2003 and 2008, the only borough to do so.)
Read the full story: Transit Overload
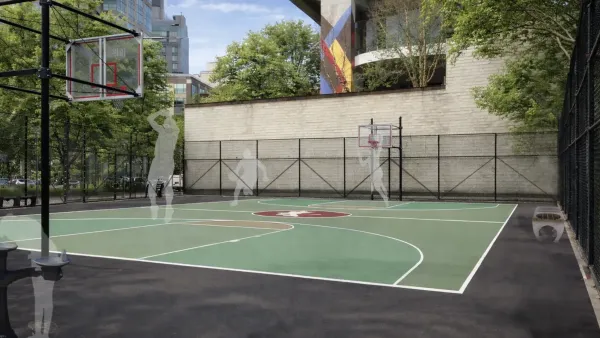
MTA gives itself 30 days to transform pit into basketball court
The site has been under construction since 2022; the city originally estimated it would finish the court in 2024.
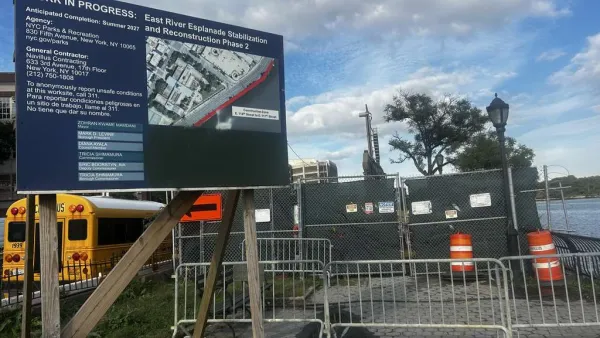
Ballooning costs delay NYC green space restoration after six years of planning
“There’s a stark inequity in how the city prioritizes infrastructure projects across different Manhattan neighborhoods," said Maria Kessler, executive director for Friends of the East River Esplanade. “Why is this neighborhood the last and unserved?”
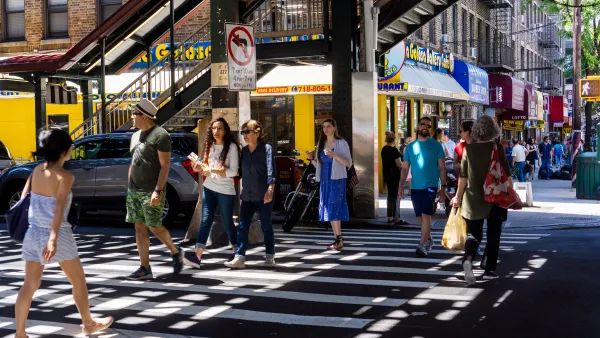
NYC needs 700,000 new homes to resolve housing crisis, report states
The report gave every neighborhood a non-binding development target.

Planetizen Federal Action Tracker
A weekly monitor of how Trump’s orders and actions are impacting planners and planning in America.
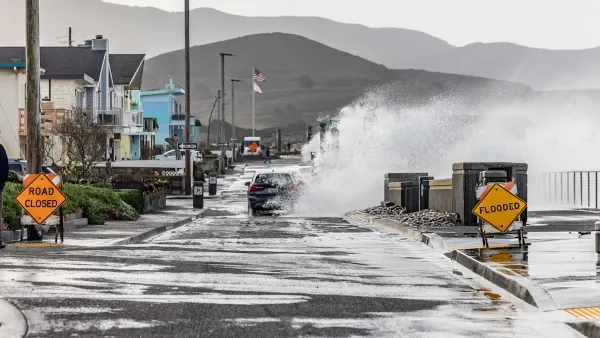
California plans to bury El Niño’s downpour
If the state plays its cards right, it may be able to store a billion acre-feet of El Niño’s water in aquifers.

Desperate measures: Advocates weigh draining Lake Powell to fill Colorado River
Draining the reservoir could reduce evaporation losses by a couple hundred thousand acre-feet.

Los Angeles just elected an urban planner as its mayor
Transportation analysts are optimistic that Raman will be more aggressive in addressing transit issues than Bass.

Mamdani’s pied-à-terre tax survives legal challenge
A panel of judges found that the plaintiffs failed to demonstrate injury as a result of New York City's implementation of the tax.

Eastern Nebraska is running out of electricity
Data centers and electrification are straining eastern Nebraska’s grid, throttling economic development.

FREE Course: Walkable City 1: Why Walkability?
After describing his path towards focusing on walkability as the essence of good planning, Jeff Speck marches through his five principal reasons for making more walkable places.
Reinventing Malls: Planning Alchemy—Turning Gray Fields Into Gold
The course focuses on the opportunities and imperatives that shape reinvention of mall sites.

City of Rosemead
Rutgers University, Edward J. Bloustein School of Planning and Public Policy
One Hundred Miles
University of Michigan School for Environment and Sustainability (SEAS)
Hunter College, City University of New York (CUNY)
The Architects Foundation
City of Cambridge
Montrose County
The Pocatello Development Authority