Trump abandoned climate protection goals claiming that cheap fossil fuel helps consumers and the economy. A mobility-focused analysis shows that he is wrong: resource efficiency is the key to health, economic success and happiness.




The U.S. federal government just revoked its scientific finding that climate change threatens public health and welfare. It feels like the first scene of a disaster movie in which clueless public officials ignore experts’ warnings of impending catastrophes. Cue ominous music!
You needn’t be a scientist to be concerned about human actions that disrupt atmospheric chemistry; we already see measurable and expensive increases in heatwaves, droughts, wildfires, hurricanes, flooding, sea level rise, famine and displacement, and associated costs (see figure below).
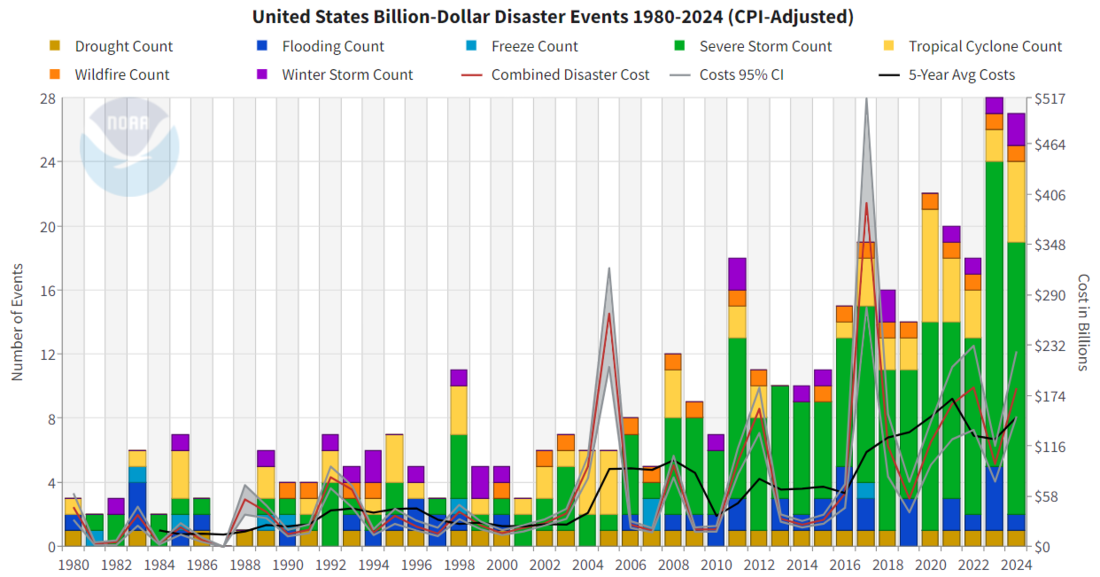
This column responds to a specific claim, that reducing fossil fuel consumption, and therefore motor vehicle travel, harms our health and economy. Trump said, “Over the generations, fossil fuels have saved millions of lives and lifted billions of people out of poverty all over the world.” There is a little truth and a lot of inaccuracy in that statement. Let’s look at the data.
If you analyze all countries for which data are readily available you’ll find that life expectancy tends to increase with energy consumption, but the relationship is weak, as illustrated below. Countries in the green box have longer life expectancy and lower energy consumption than in North America.
Life Expectancy Versus Energy Use (All Countries)
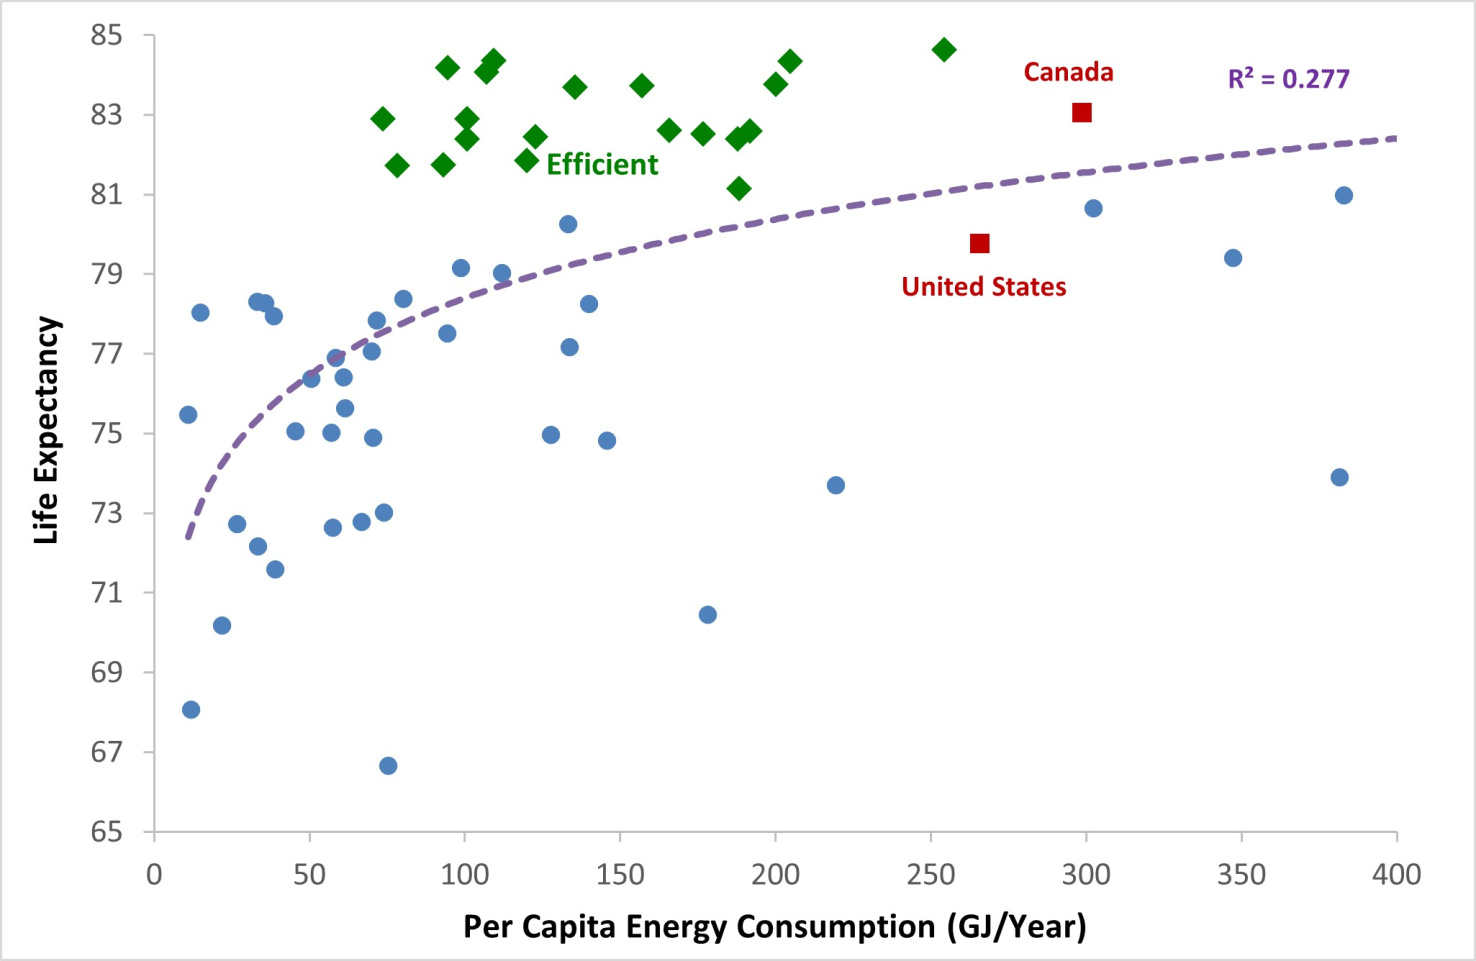
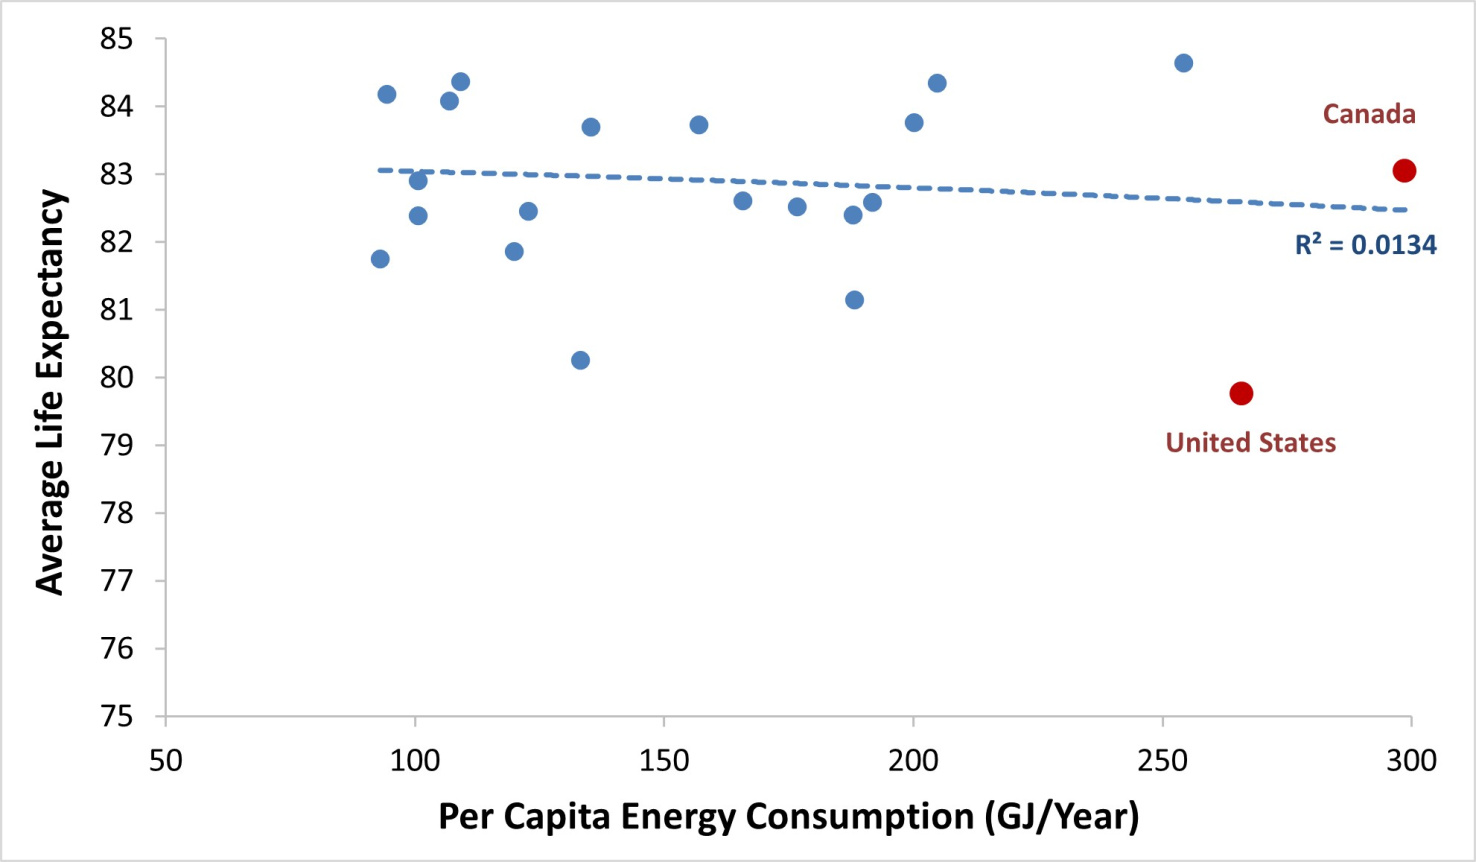
This reflects diminishing marginal benefits. Boston University’s Institute for Global Sustainability concludes, “At low levels of energy use, very modest increases help drive significant increases in life expectancy. But after about 40 to 50 GJ per capita, additional increases in energy use per capita are associated with smaller and smaller increases in life expectancy. At high levels of energy use per capita, there is little connection with longevity.” Among higher-income countries the relationship between energy consumption and life expectancy is slightly negative, as illustrated below.
Life Expectancy Versus Energy Use (Peer Countries)
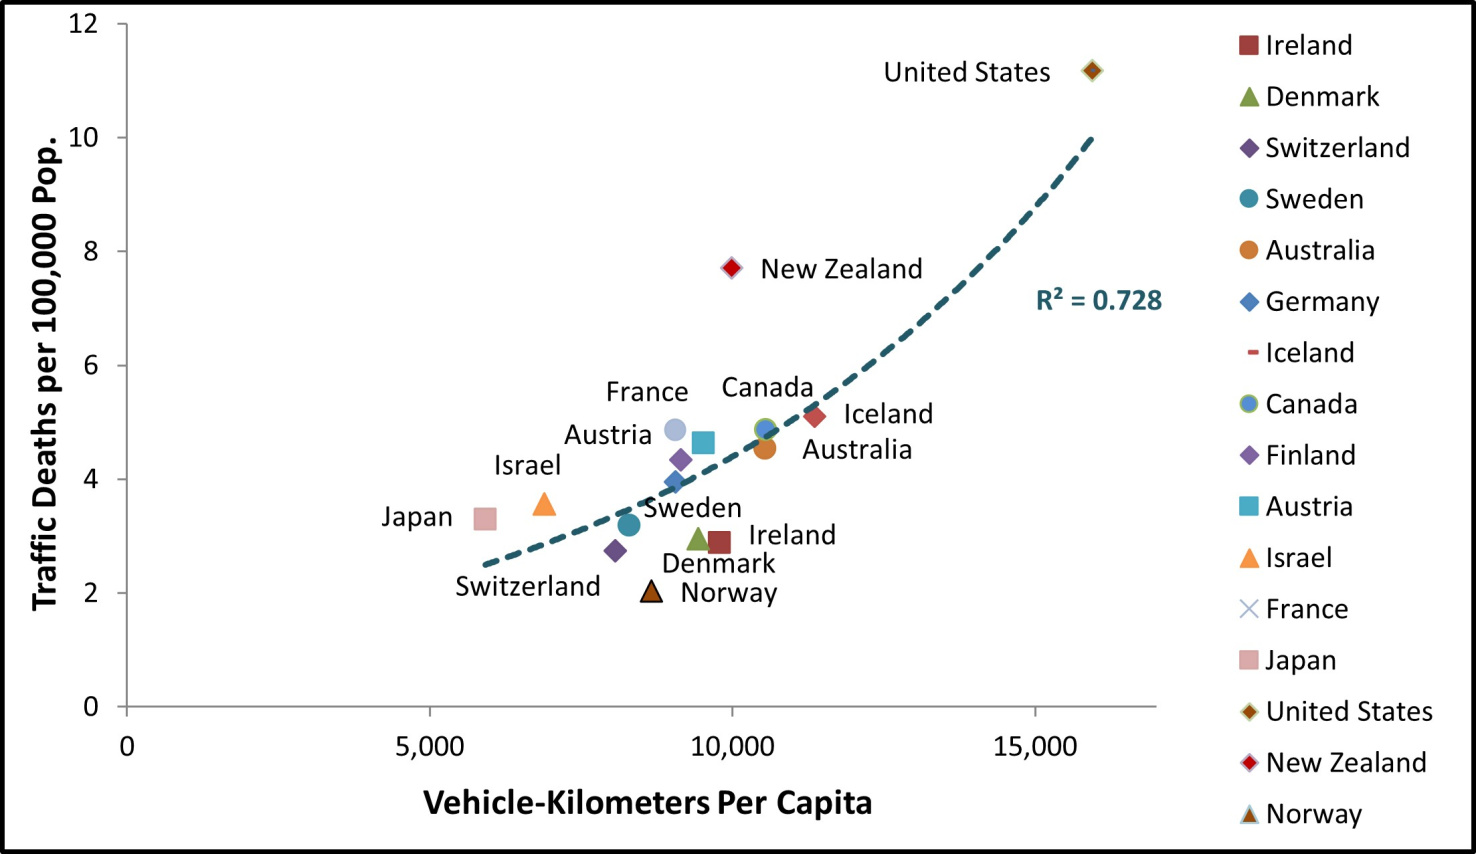
The negative health effects of high energy consumption result, in part, from high per capita automobile travel and low rates of walking and bicycling, which increase crashes, pollution and sedentary living, and associated health problems such as traffic injuries, cardiovascular and respiratory illnesses and diabetes. The following figure shows the positive relationship between per capita vehicle travel and traffic deaths. The U.S.’s very high traffic death rate can be explained by high per capita vehicle travel. Put simply, driving is deadly and multimodalism is a panacea.
Per Capita Traffic Deaths versus Vehicle-Travel
Now, let’s look at the idea that cheap energy and high levels of motor vehicle travel are good for the economy. The figure below shows the relationship between vehicle ownership and economic productivity (measured as per capita Gross Domestic Product, or GDP) for 166 countries. Vehicle ownership increases with GDP up to about $50,000 per capita but subsequently declines, as illustrated below.
Productivity Versus Vehicle Ownership by Country (Vehicles and GDP)
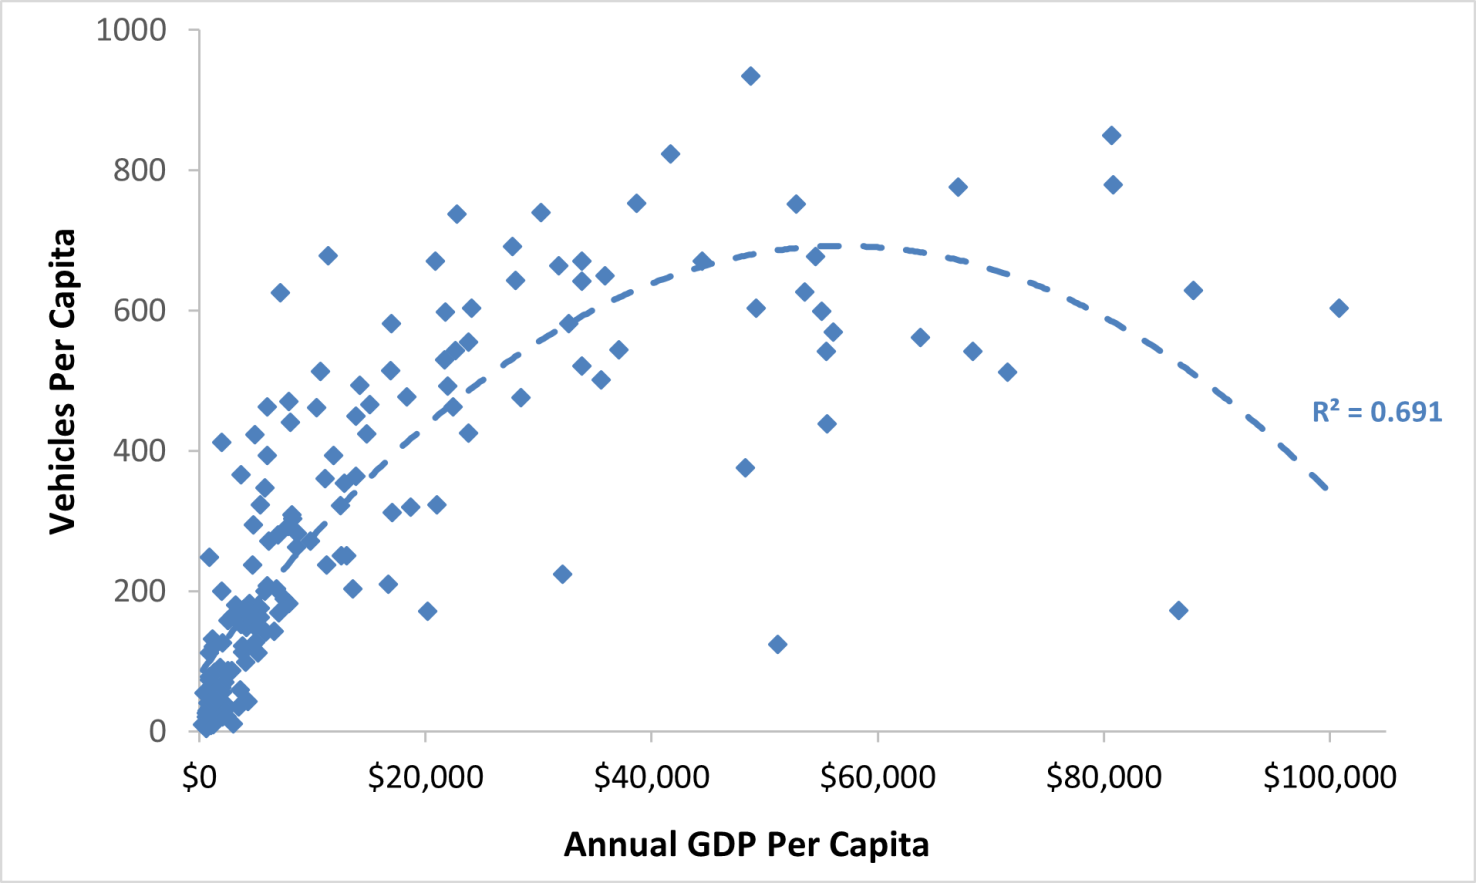
This suggests that beyond optimal levels, additional vehicle travel is economically harmful, more evidence of declining marginal benefits: too much of a good thing are not good. During the twentieth century, vehicle travel and economic productivity were closely aligned. But in the twenty-first century per capita vehicle travel peaked while productivity continued to grow as new efficiencies and technologies reduced the amount of vehicle travel required for economic activities. This indicates that in developed countries, productivity and vehicle travel have decoupled, as illustrated below.
U.S. Productivity and Vehicle Travel Trends (FHWA and BEA Data)

Productivity Versus Vehicle Travel for U.S. States (FHWA 2020, PS-1)
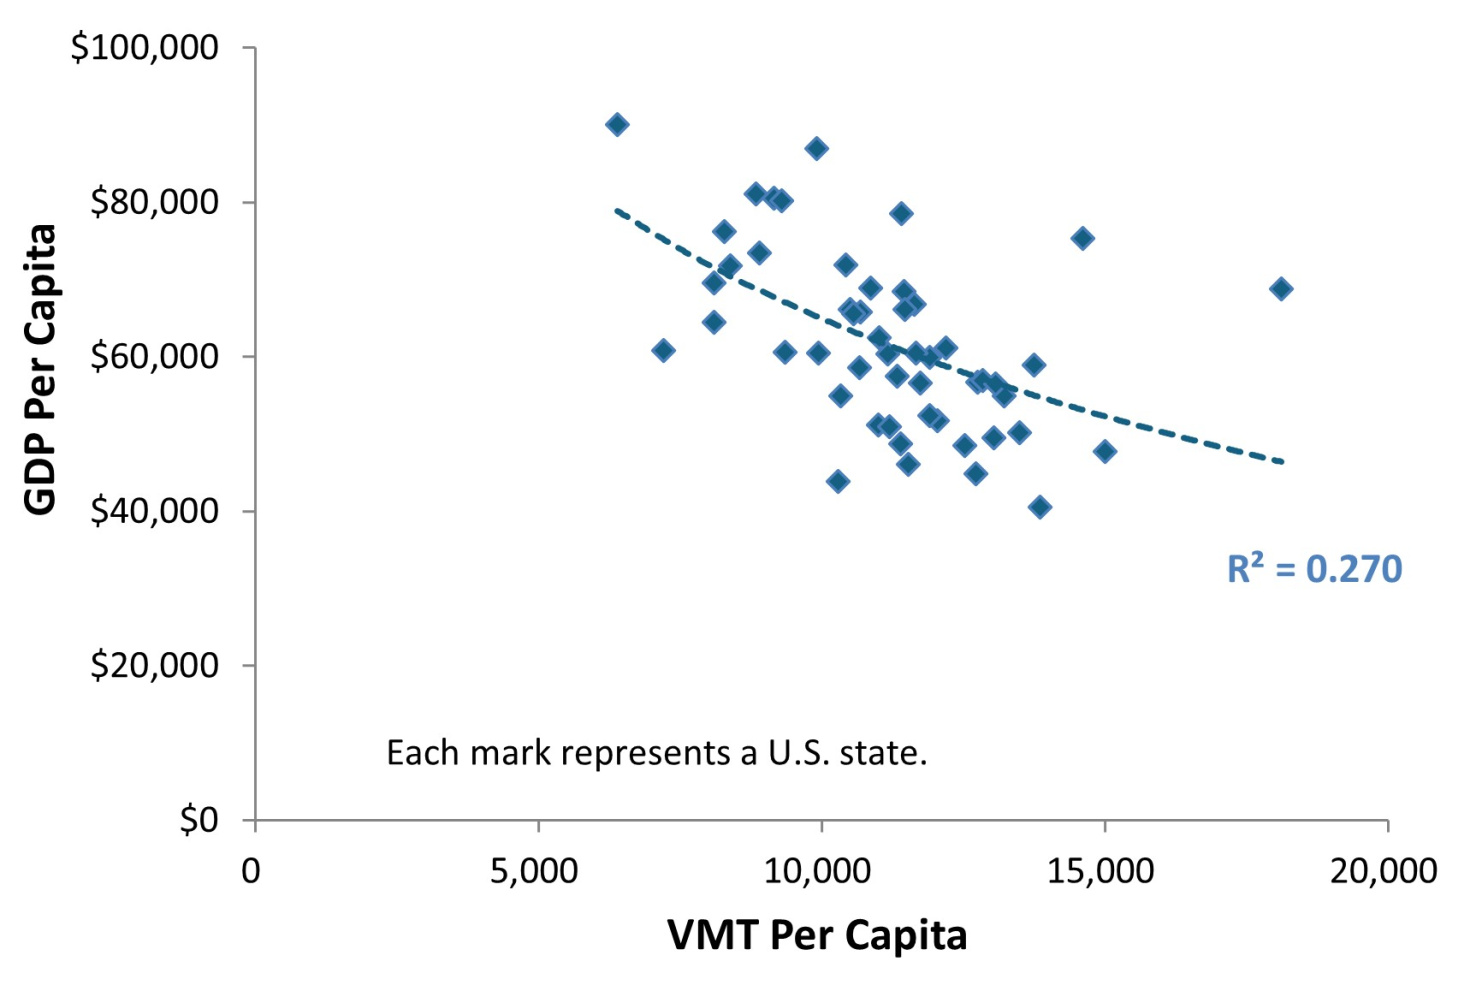
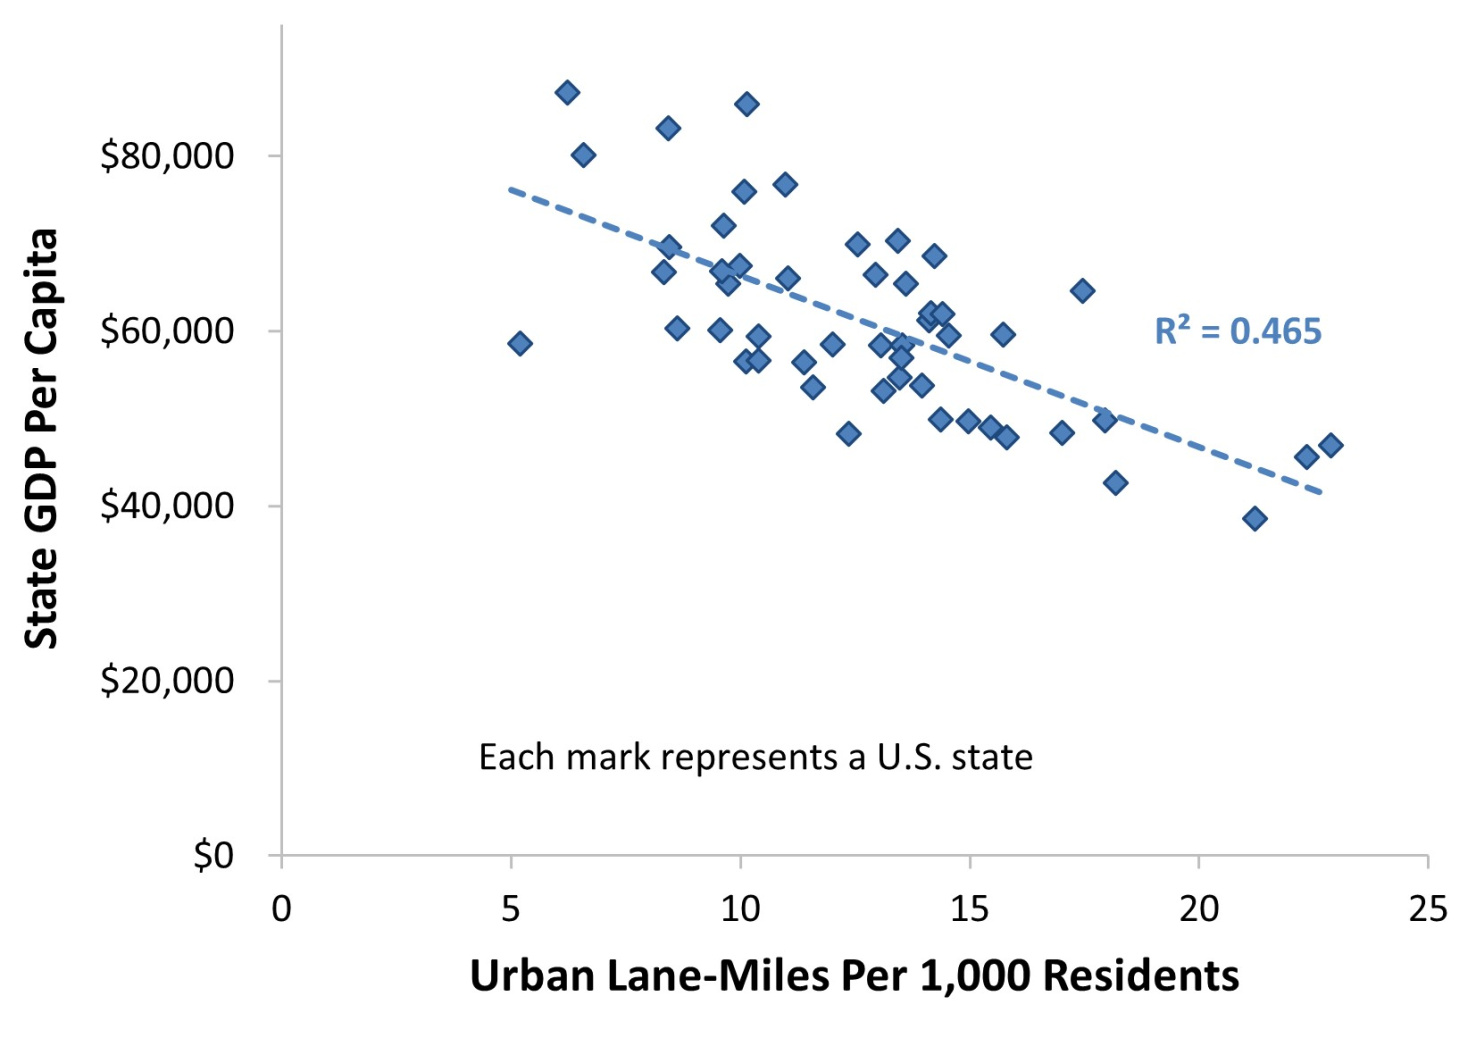
The figure below shows that productivity declines with more urban lane-miles. This contradicts the common assumption that urban roadway expansions reduce congestion and support economic development.
Productivity Versus Urban Lane Miles
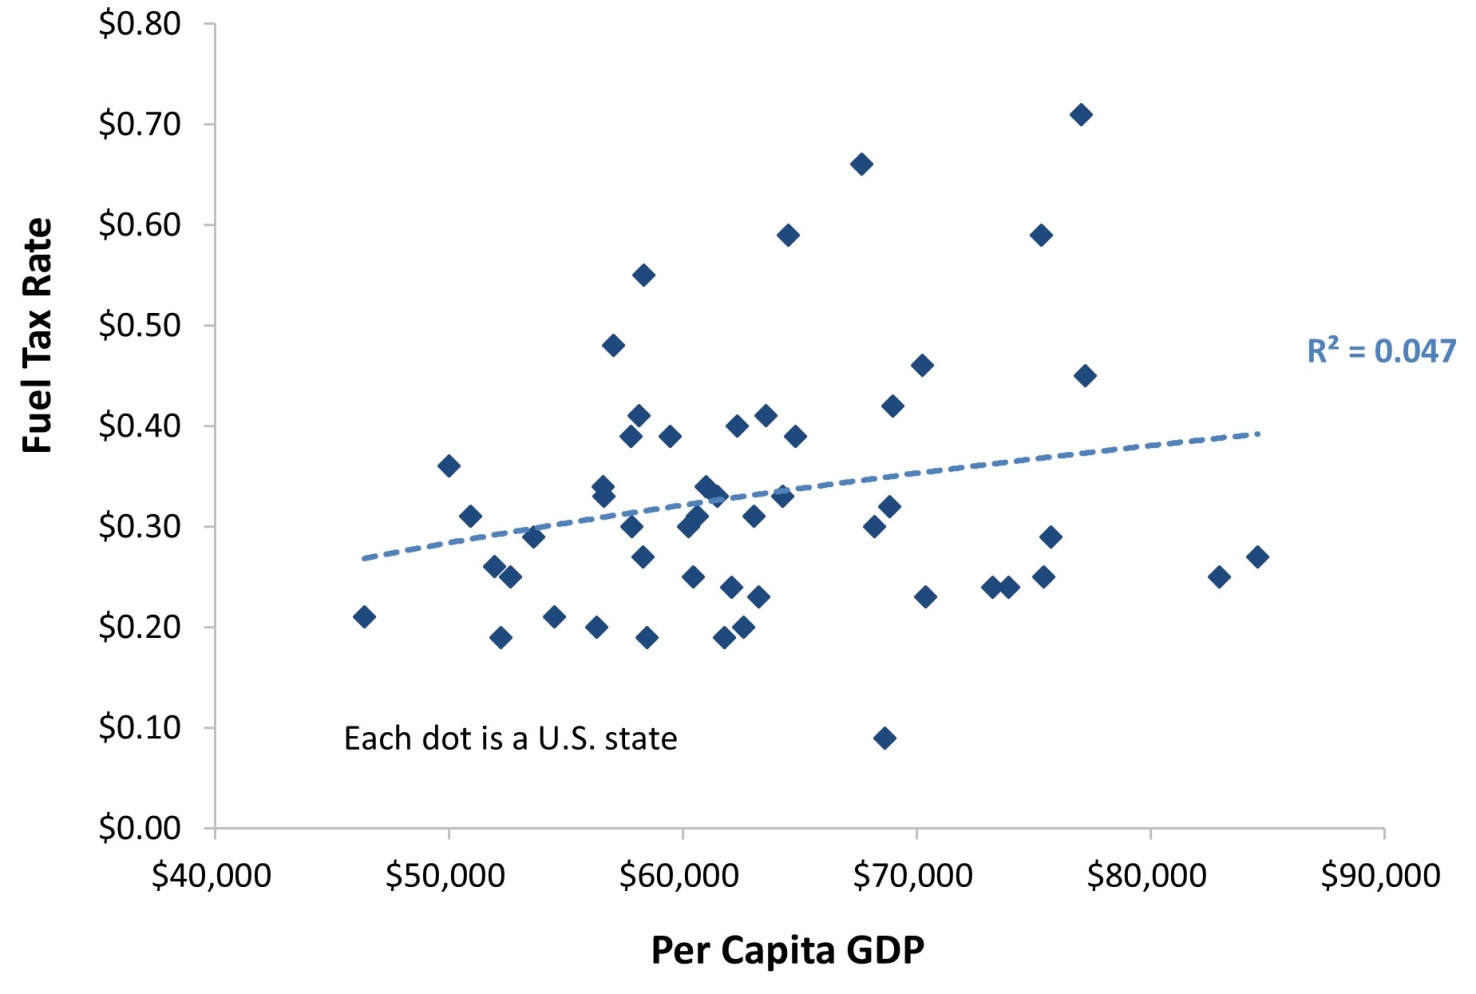
Many people assume that low fuel prices increase economic productivity by reducing producer and consumer costs, but the relationship is often positive; higher fuel prices are associated with more economic productivity, as illustrated in the following graphs. The first shows that per capita GDP tends to increase with fuel prices for U.S. States. This relationship is admittedly statistically weak, but the real question is: why isn't it strongly negative as advocates for low fuel taxes claim?
Productivity Versus Fuel Taxes
The graph below shows per capita GDP versus fuel prices for 163 countries categorized into petroleum importers and exporters. The relationship is positive, particularly for petroleum importing countries. This suggests that higher fuel prices increase productivity by encouraging energy and transportation efficiency, equivalent to putting the transportation system on a healthy diet.
Productivity Versus Fuel Prices (Global Petrol Prices 2025)
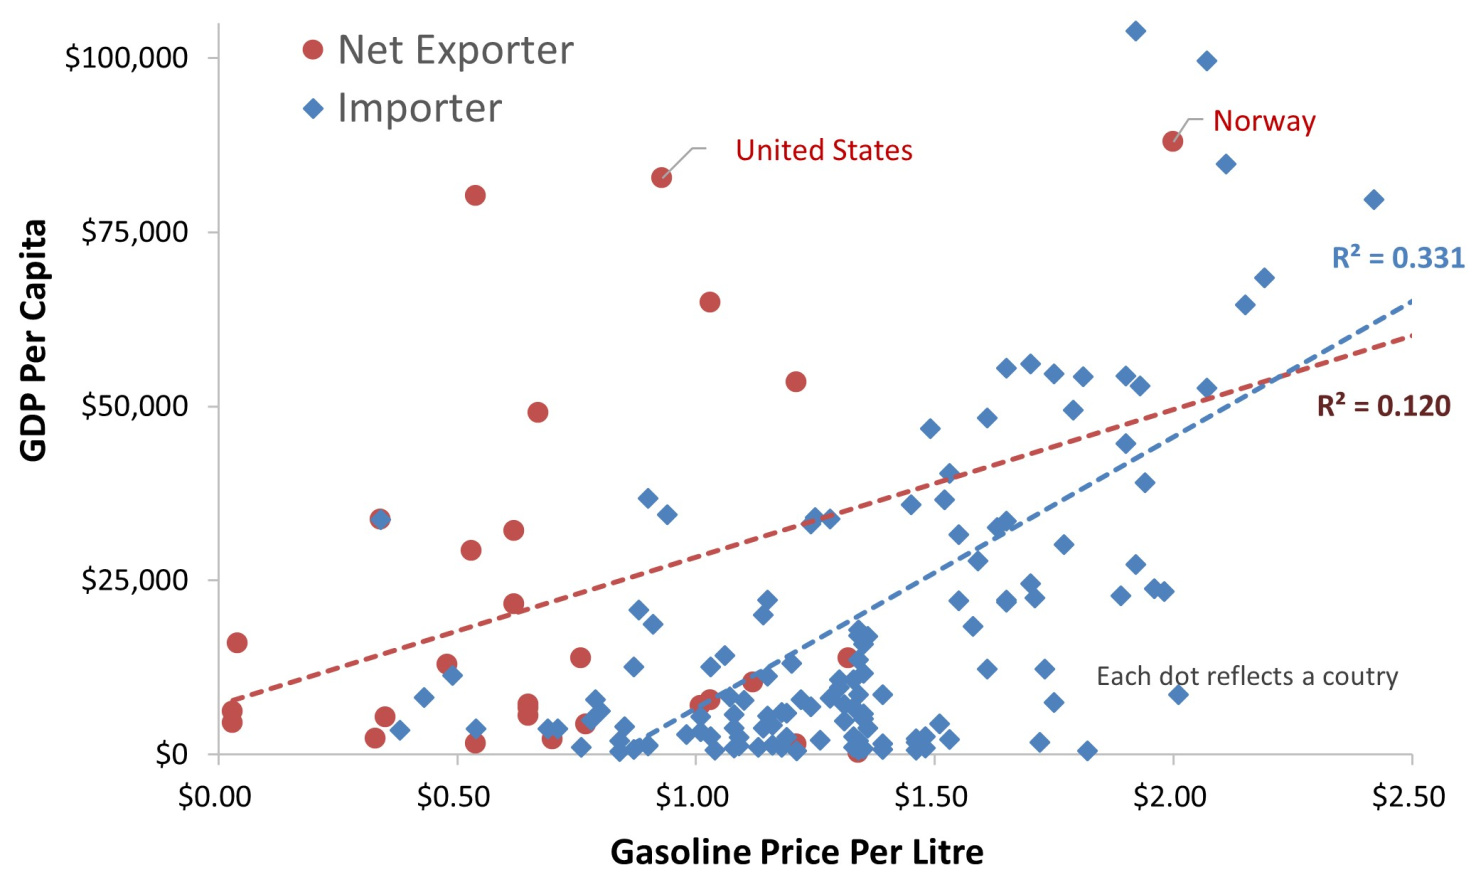
This relationship is particularly strong for petroleum importing countries, which makes sense from a mobility perspective, since higher fuel prices increase transportation system efficiency and dampen fuel and vehicle import costs which leaves more money circulating in their national economy. Petroleum producing countries can also benefit from high fuel prices to discourage domestic consumption, leaving more product to export. A good example is Norway, a major petroleum producer that maintains one of the world’s highest fuel taxes and invests heavily in non-auto modes, resulting in a diverse and successful economy. In contrast, oil producing countries with low fuel prices, such as Venezuela, Nigeria and Iran, fail to develop non-petroleum industries, reflecting what economists call a resource curse.
These findings are the opposite of what ignorant people assume. Why, you may ask, do more driving, expanded urban roads and cheaper fuel reduce productivity and competitiveness? My report, The Mobility-Productivity Paradox, identifies several factors that explain this:
- Expanded roads and parking facilities, increased vehicle travel and sprawl tend to reduce overall accessibility, increasing the amount of travel needed to reach services and activities. This reduces overall efficiency.
- Expenditures on vehicles and fuel generate fewer local jobs and business activity per dollar than most other goods. This reduces dollars circulating in the local economy compared with other forms of mobility and accessibility.
- Motor vehicle travel imposes external costs — road and parking infrastructure subsidies, congestion, crash damages and pollution emissions — that burden households, businesses and local economies.
- Sprawl increases the costs of providing public infrastructure and services; more compact development provides large savings.
- Low fuel taxes encourage inefficient travel and increase the subsidies required to finance roadways.
- Automobile dependency and sprawl reduce non-drivers economic opportunities — access to education, employment and affordable goods — and therefore businesses ability to attract workers and customers, which reduces productivity. Multimodal planning is more efficient and equitable.
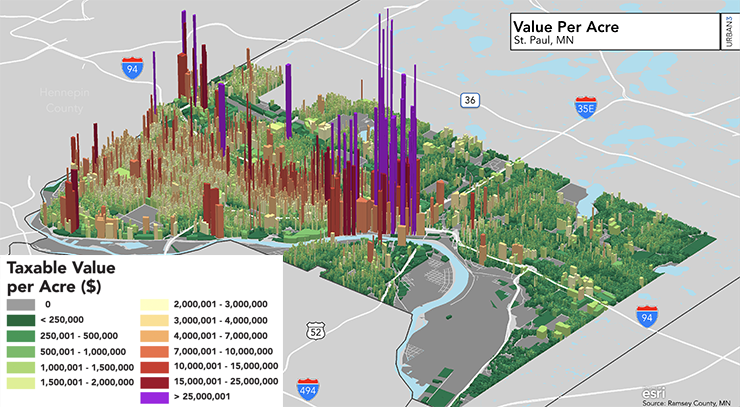
These impacts occur at various geographic scales. Compact and multimodal development tends to generate higher property values, tax revenue and net municipal fiscal returns (more tax revenue than public service costs) per acre than auto-dependent sprawl, as illustrated in the heatmap below. Improving non-auto modes, reducing auto trips, and reducing parking mandates supports such development, making communities more efficient.
Taxable Value per Acre Heatmap
Of course, economic development is not an end in itself; our ultimate goal is to maximize happiness. The following graph from the Happiness and Life Satisfaction website indicates that life satisfaction (an indicator of happiness) increases with Gross National Product (GDP), but the GDP values are logarithmic which exaggerates this relationship.
Life Satisfaction Vs. GDP (Logarithmic GDP Scale)
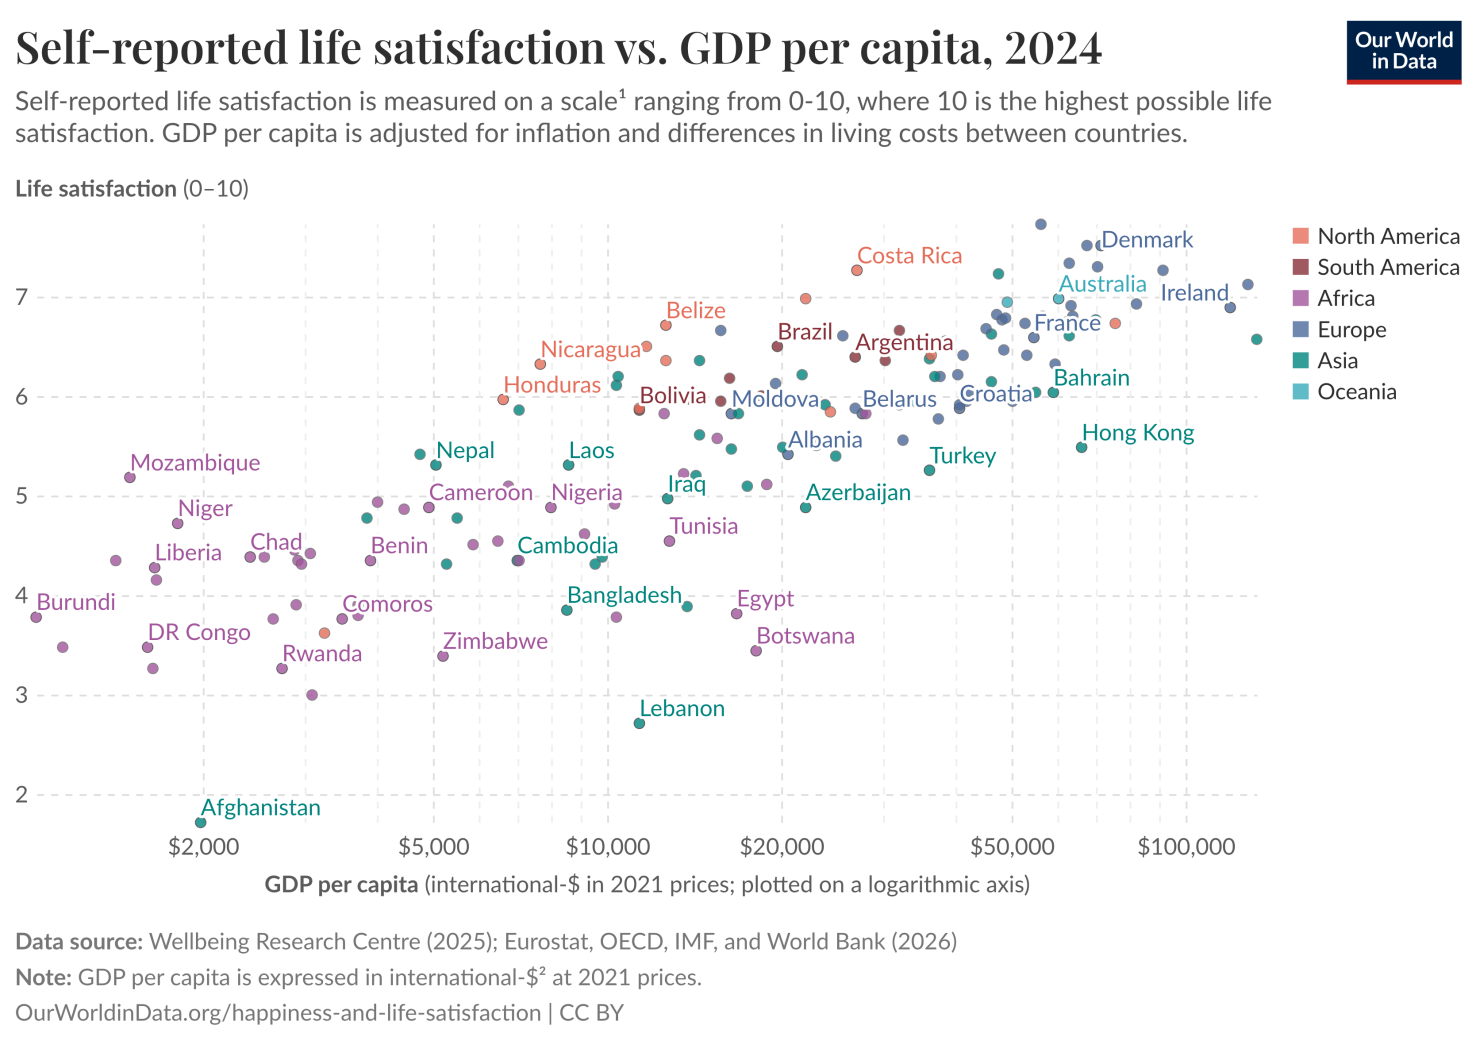
The figure below shows the same data using a linear scale. This indicates that above $20,000 annual GDP the relationship between GDP and life satisfaction is statistically weak and peaks at about $50,000, above which it becomes negative, probably because factors such as longer work hours and higher living costs increase productivity in ways that make people unhappy. This suggests that efforts to increase productivity and incomes should focus on lower-GDP regions and lower-income households; at high levels further increases do little to increase happiness and can reduce it by increasing costs and stress.
Life Satisfaction Vs. GDP (Linear GDP Scale)
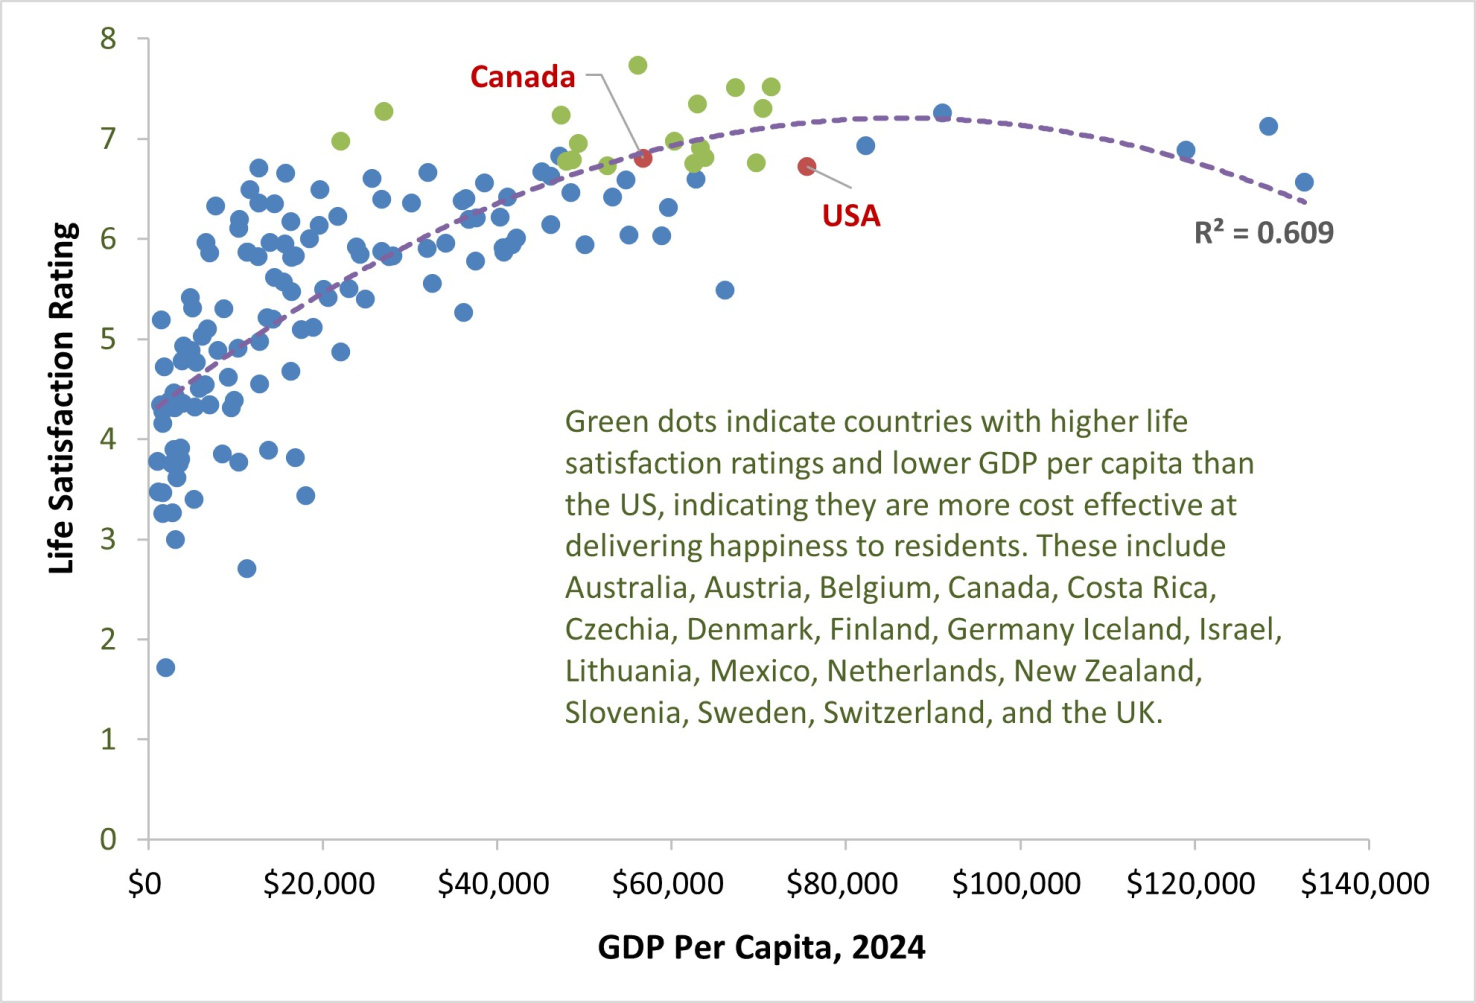
Green dots show countries where residents have higher life satisfaction with less economic effort than in the USA, indicating that residents can be happy with modest incomes because their economies are more efficient at serving human needs. These include Australia, Austria, Belgium, Canada, Costa Rica, Czechia, Denmark, Finland, Germany Iceland, Israel, Lithuania, Mexico, Netherlands, New Zealand, Slovenia, Sweden, Switzerland, and the United Kingdom.
This analysis shows that common economic assumptions are outdated; perhaps a hundred years ago cheap energy and increased vehicle travel provided broad benefits that filtered through society, increasing most people's health, opportunities, wealth and happiness. But those days are long over in North America.
Planners have a positive message to share. With smarter policies, our needs can be satisfied with much lower energy and mobility costs: less is more. Resource efficiency is not only good for the environment — it also helps improve health, wealth and happiness.
For More Information
Tim Althoff, et al. (2025), “Countrywide Natural Experiment Links Built Environment to Physical Activity,” Nature.
Marlon G. Boarnet, et al. (2017), The Economic Benefits of Vehicle Miles Traveled (VMT)- Reducing Placemaking, National Center for Sustainable Transportation.
Chad Frederick, Anna Hammersmith and John Hans Gilderbloom (2019), "Putting ‘Place’ in its Place: Comparing Place-based Factors in Interurban Analyses of Life Expectancy in the U.S.,” Social Science & Medicine.
Todd Litman (2025), Planning Communities for Thriving Children, Planetizen.
Todd Litman (2025), Mobility-Productivity Paradox, Planetizen.
Todd Litman (2025), Planning for Quality of Life Considering Community Cohesion and Related Social Goals, Victoria Transport Policy Institute.
B. Starr McMullen and Nathan Eckstein (2011), The Relationship Between Vehicle Miles Traveled and Economic Activity, OTREC.
WHO (2024), Global Action Plan on Physical Activity 2018–2030: More Active People for a Healthier World, World Health Organization.


EPA Report Highlights Dire Impacts of Climate Change
The latest edition of the “Climate Change Indicators in the United States” report highlights the severe and widespread impacts of climate change on health and the environment, emphasizing the urgent need for action to mitigate these effects.

Trump's proposed budget slashes EPA funding by 52%
The budget also reduces funding for FEMA, climate resilience projects, and water infrastructure programs.

EPA Guts Emissions Regulations
The agency is eliminating the endangerment finding that underpins the agency’s authority to regulate greenhouse gas emissions.

Planetizen Federal Action Tracker
A weekly monitor of how Trump’s orders and actions are impacting planners and planning in America.

‘Going backwards:’ Baltimore mayor, students rally against state's transit funding plan
Maryland's proposed six-year plan provides no funding for Baltimore’s BMORE bus program and reduces its road maintenance funding.

Detroit to transform waterfront with $2.2 billion investment
Developers will convert about 18 acres of unused parking lot space into civic spaces.

HUD modernizes 50-year-old manufactured housing framework
The Next Generation Manufactured Housing Action Plan establishes new energy-efficiency standards for manufactured homes, and new guidelines for anchoring them.

New CA housing laws tear down development red tape
Recently-signed legislation makes building starter homes and ADUs cheaper and faster in California.

Metrolink finishes first expansion in 20 years
The transit agency is now one of very few in the United States to connect two major airports.

FREE Course: Walkable City 1: Why Walkability?
After describing his path towards focusing on walkability as the essence of good planning, Jeff Speck marches through his five principal reasons for making more walkable places.
Reinventing Malls: Planning Alchemy—Turning Gray Fields Into Gold
The course focuses on the opportunities and imperatives that shape reinvention of mall sites.

One Hundred Miles
County of Mendocino
planning NEXT
The Architects Foundation
University of Cincinnati Online
Montrose County
Northern Illinois Transit Authority (NITA)
The Pocatello Development Authority

