For the first 5 months of 2000, new industrial permit values in LosAngeles County continued to lag the year ago, but the gap seems to benarrowing, down just 2.3%.
Office construction was well behind, by a stout56.2%. However, retail development is picking up, with the 5-month total12.6% ahead of last year. Imagine, more places to buy the same old stuff! Industrial activity in Orange County was running 65.1% behind last year,but new office activity was up 91.0% so far, while retail was ahead 64.0%. Things remain hot in the Riverside-San Bernardino area. Industrialpermit valuations through May were up 32.0% despite the large base. Officevaluations were up 63.0%, but on a small base, while retail activity was up81.3% on a large base. In San Diego County, industrial constructionlagged, down 16.8%, but office and retail were running ahead of the 1999pace, by 69.4% and 119.6%, respectively. In Ventura County, industrialpermit valuations were up 58.7%, and office was ahead 201.4% (small base),but retail continues to lag, off 84.3% from 1999. In the San Francisco Bay Region, the 5 month value of industrialpermits was up 15.7%, thanks to a surge in Alameda County. Office permitvaluations were up 212.9%, with the hot spots being San Francisco and SantaClara Counties. However, retail activity lagged, down 21.0% from last year. And a quick note on vacancy rates. Grubb & Ellis reports that in thefirst quarter of 2000 office vacancy rates were 12.7% in Los AngelesCounty, 9.5% in Orange County, 16.6% in Riverside-San Bernardino, 7.2% inSan Diego County, and 7.7% in Ventura County. Industrial vacancy rateswere 4.1% in Los Angeles County (with the central area at 2.1%), 7.7% inOrange County, 7.8% in Riverside-San Bernardino (its ability to soak upspace is awesome), 9.1% in San Diego and 7.0% in Ventura County. (Jack Kyser)
Thanks to Chris Steins
FULL STORY: Non Residential Activity Mixed in May

Planetizen Federal Action Tracker
A weekly monitor of how Trump’s orders and actions are impacting planners and planning in America.

Restaurant Patios Were a Pandemic Win — Why Were They so Hard to Keep?
Social distancing requirements and changes in travel patterns prompted cities to pilot new uses for street and sidewalk space. Then it got complicated.

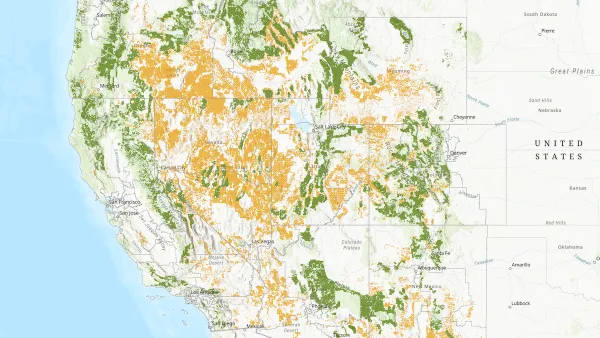
Map: Where Senate Republicans Want to Sell Your Public Lands
For public land advocates, the Senate Republicans’ proposal to sell millions of acres of public land in the West is “the biggest fight of their careers.”

Maui's Vacation Rental Debate Turns Ugly
Verbal attacks, misinformation campaigns and fistfights plague a high-stakes debate to convert thousands of vacation rentals into long-term housing.

San Francisco Suspends Traffic Calming Amidst Record Deaths
Citing “a challenging fiscal landscape,” the city will cease the program on the heels of 42 traffic deaths, including 24 pedestrians.

California Homeless Arrests, Citations Spike After Ruling
An investigation reveals that anti-homeless actions increased up to 500% after Grants Pass v. Johnson — even in cities claiming no policy change.
Urban Design for Planners 1: Software Tools
This six-course series explores essential urban design concepts using open source software and equips planners with the tools they need to participate fully in the urban design process.
Planning for Universal Design
Learn the tools for implementing Universal Design in planning regulations.
Heyer Gruel & Associates PA
JM Goldson LLC
Custer County Colorado
City of Camden Redevelopment Agency
City of Astoria
Transportation Research & Education Center (TREC) at Portland State University
Camden Redevelopment Agency
City of Claremont
Municipality of Princeton (NJ)


