


The Social Vulnerability Index (SVI) is a resource that can be used by public agencies to identify parts of a community that are most in need of investment.
The Social Vulnerability Index (SVI) is a resource provided by the Centers for Disease Control and Prevention/Agency for Toxic Substances and Disease Registry (CDC/ATSDR). The SVI measures social vulnerability which is defined by CDC/ATSDR as the potential negative effects on communities caused by external stresses on human health.
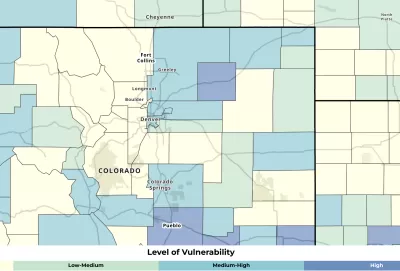
The SVI is a valuable tool to identify communities that will most likely need support before, during and after a public health emergency. It uses 16 U.S. census variables to help local officials identify communities that may need support before, during, or after disasters. More broadly, SVI is an indicator of which areas of a community are considered “at risk” and most in need of investment to reduce vulnerability and increase overall health.
In this blog post, Austin Barrett of the National Recreation and Park Association (NRPA) highlights the SVI as a tool that can be used to help park and recreation agencies with their decision-making regarding future capital and operational investments. The SVI is one of the resources featured in NRPA's recently created Data and Mapping Resource Library which was previously discussed in in this article.
The use of vulnerability indicators is becoming more widespread as public agencies seek to identify and prioritize the most vulnerable areas and populations for planning, services, programs, and capital investments. For example, the Los Angeles County Department of Parks and Recreation (DPR) recently completed the Parks Needs Assessment Plus (PNA+) which uses indicators from the Healthy Places Index (HPI) and other data to identify where the most vulnerable residents are concentrated and determine which areas should be prioritized for conservation and restoration as well as regional and rural recreation.
FULL STORY: Featured Data Resource: Social Vulnerability Index


Planetizen Federal Action Tracker
A weekly monitor of how Trump’s orders and actions are impacting planners and planning in America.

Congressman Proposes Bill to Rename DC Metro “Trump Train”
The Make Autorail Great Again Act would withhold federal funding to the system until the Washington Metropolitan Area Transit Authority (WMATA), rebrands as the Washington Metropolitan Authority for Greater Access (WMAGA).

DARTSpace Platform Streamlines Dallas TOD Application Process
The Dallas transit agency hopes a shorter permitting timeline will boost transit-oriented development around rail stations.

Texas Moves to Curb Orphan Wells, But Critics Say Loopholes Remain
A proposed state law would shift financial responsibility for sealing unused drilling sites from the public to energy operators, though some advocates question its effectiveness due to industry-backed exemptions.

Affordable Housing Finance 101
The financial intricacies involved in building affordable housing can be difficult to understand. This explainer breaks down the foundational concepts.

San Francisco's School District Spent $105M To Build Affordable Housing for Teachers — And That's Just the Beginning
SFUSD joins a growing list of school districts using their land holdings to address housing affordability challenges faced by their own employees.
Urban Design for Planners 1: Software Tools
This six-course series explores essential urban design concepts using open source software and equips planners with the tools they need to participate fully in the urban design process.
Planning for Universal Design
Learn the tools for implementing Universal Design in planning regulations.
Municipality of Princeton
Roanoke Valley-Alleghany Regional Commission
City of Mt Shasta
City of Camden Redevelopment Agency
City of Astoria
Transportation Research & Education Center (TREC) at Portland State University
US High Speed Rail Association
City of Camden Redevelopment Agency
Municipality of Princeton (NJ)