


Using data from Microsoft, the New York Times has published an online map showing the placement of every building in the country, in a simple black and white format.
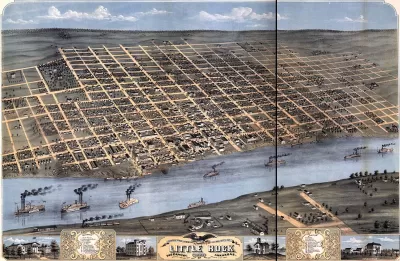
Platforms like Google Maps and Apple Maps may already have every building mapped, in a sense, but this new resource from The New York Times makes it far easier to discern patterns of development, density, and street layout. The key is a black and white format that shows the footprint of every building along with some minimal labeling of neighborhoods and streets.
The Times drew these images from a Microsoft database released to the public this year, with supplemental data from some state and local governments. Tim Wallace, Derek Watkins, and John Schwartz write, "The company's computer engineers trained a neural network to analyze satellite imagery and then to trace the shapes of buildings across the country. Such information has been available before in some places, but this is the first comprehensive database covering the entire United States."
They go on, "Classic maps answer questions like: How do I get from Point A to Point B? These data images, instead, evoke questions — sometimes, simply: What's that?" The piece highlights several developmental patterns that demonstrate the diversity and historical roots of America's built environment.
FULL STORY: A Map of Every Building in America

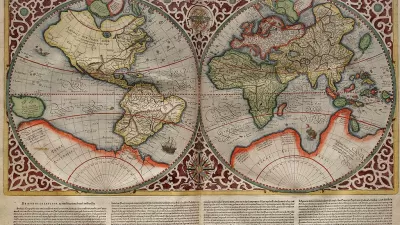
Map-Correcting App Shows 'The True Size Of' Places
Typical world maps badly misrepresent the size of countries; a new web app shows their true scale.
Mapping the Nation's Well-Being
Who's the happiest and healthiest of them all? The New York Times posts an interactive map of the national Gallup-Healthways Well-Being Index.

The Built Environment in 2022: Challenges and Opportunities
As climate change, the pandemic, and a historic housing crisis continue to impact the nation, experts weigh in on the issues that could shape the future of the built environment in 2022.

Planetizen Federal Action Tracker
A weekly monitor of how Trump’s orders and actions are impacting planners and planning in America.

Congressman Proposes Bill to Rename DC Metro “Trump Train”
The Make Autorail Great Again Act would withhold federal funding to the system until the Washington Metropolitan Area Transit Authority (WMATA), rebrands as the Washington Metropolitan Authority for Greater Access (WMAGA).

DARTSpace Platform Streamlines Dallas TOD Application Process
The Dallas transit agency hopes a shorter permitting timeline will boost transit-oriented development around rail stations.

Renters Now Outnumber Homeowners in Over 200 US Suburbs
High housing costs in city centers and the new-found flexibility offered by remote work are pushing more renters to suburban areas.

The Tiny, Adorable $7,000 Car Turning Japan Onto EVs
The single seat Mibot charges from a regular plug as quickly as an iPad, and is about half the price of an average EV.

Supreme Court Ruling in Pipeline Case Guts Federal Environmental Law
The decision limits the scope of a federal law that mandates extensive environmental impact reviews of energy, infrastructure, and transportation projects.
Urban Design for Planners 1: Software Tools
This six-course series explores essential urban design concepts using open source software and equips planners with the tools they need to participate fully in the urban design process.
Planning for Universal Design
Learn the tools for implementing Universal Design in planning regulations.
Municipality of Princeton
Roanoke Valley-Alleghany Regional Commission
City of Mt Shasta
City of Camden Redevelopment Agency
City of Astoria
Transportation Research & Education Center (TREC) at Portland State University
US High Speed Rail Association
City of Camden Redevelopment Agency
Municipality of Princeton (NJ)