


According to federal data, the average number of safety incidents on public transportation averaged 55.2 per 100,000 people across all states between 2010 and 2023. Which states came in well above the national average?
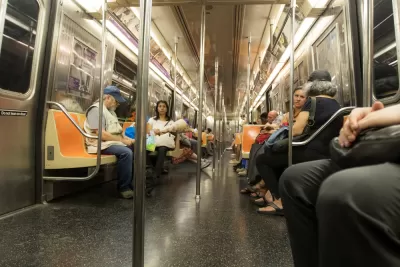
Rider safety on public transportation has been a huge topic in the news of late, from bus and train collisions to transit agencies grappling with violence in stations and on vehicles. Property Casualty 360 reported recent data analysis by H&P law that ranked states according to safety risk to riders. The data, which came from the U.S. Bureau of Transportation Statistics, showed the average number of incidents (combined fatalities, collisions, and injuries) on transportation vehicles across all U.S. states was 55.2 per 100,00 people from 2010 to 2023.
According to the analysis, here are the 10 states where riders face the most risk:
- New York: 45,732 total incidents; 230.3 incidents per 100,000 residents; 317% above national average (NA)
- Illinois: 20,910 total incidents; 64.8 incidents per 100,000 residents; 198% above NA
- Delaware: 1,607 total incidents; 159.9 incidents per 100,000 residents; 189% above NA
- Pennsylvania: 17,725 total incidents; 136.2 incidents per 100,000 residents; 147% above NA
- Maryland: 7,448 total incidents; 120.6 incidents per 100,000 residents; 18.4% above NA
- Massachusetts: 7,749 total incidents; 110.8 incidents per 100,000 residents; 101% above NA
- b 9,221 total incidents; 99.5 incidents per 100,000 residents; 80% above NA
- Missouri: 5,463 total incidents; 88.5 incidents per 100,000 residents; 60% above NA
- Hawaii: 1,269 total incidents; 87.7 incidents per 100,000 residents; 59% above NA
- Connecticut: 3,138 total incidents; 87.1 incidents per 100,000 residents; 58% above NA
It’s an interesting data snapshot to be sure. However, the numbers don’t seem to reflect the fact that public transportation access and availability vary by state, even between states with comparable populations. Of course states with larger, more robust transit networks will have more transit-related incidents per capita than states with fewer and smaller transit offerings. Perhaps an analysis of incidents per 100,000 rides (rather than per 100,000 people) would paint a more accurate picture.
FULL STORY: These states have the most public transit incidents


Chicago Transit Recovery Trails Behind Other Major US Cities
Sluggish ridership rates and staffing shortages are dampening recovery. Looming budget gaps could make things even worse.
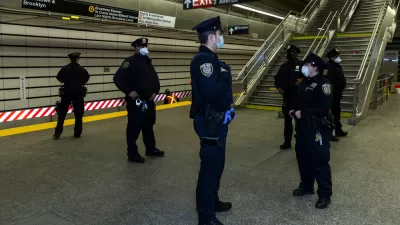
Safety Concerns Driving Riders Away From Transit
Public transit systems in major U.S. cities are struggling to restore their image after rising crime rates led to heightened security concerns among riders.
Voters Approved 100 Percent of Pro-Transit Ballot Measures This Year
In 2021, public transit-related ballot measures passed with strong support across the country.

Maui's Vacation Rental Debate Turns Ugly
Verbal attacks, misinformation campaigns and fistfights plague a high-stakes debate to convert thousands of vacation rentals into long-term housing.

Planetizen Federal Action Tracker
A weekly monitor of how Trump’s orders and actions are impacting planners and planning in America.

San Francisco Suspends Traffic Calming Amidst Record Deaths
Citing “a challenging fiscal landscape,” the city will cease the program on the heels of 42 traffic deaths, including 24 pedestrians.

Defunct Pittsburgh Power Plant to Become Residential Tower
A decommissioned steam heat plant will be redeveloped into almost 100 affordable housing units.

Trump Prompts Restructuring of Transportation Research Board in “Unprecedented Overreach”
The TRB has eliminated more than half of its committees including those focused on climate, equity, and cities.

Amtrak Rolls Out New Orleans to Alabama “Mardi Gras” Train
The new service will operate morning and evening departures between Mobile and New Orleans.
Urban Design for Planners 1: Software Tools
This six-course series explores essential urban design concepts using open source software and equips planners with the tools they need to participate fully in the urban design process.
Planning for Universal Design
Learn the tools for implementing Universal Design in planning regulations.
Heyer Gruel & Associates PA
JM Goldson LLC
Custer County Colorado
City of Camden Redevelopment Agency
City of Astoria
Transportation Research & Education Center (TREC) at Portland State University
Jefferson Parish Government
Camden Redevelopment Agency
City of Claremont