


The Social Vulnerability Index (SVI) is a resource that can be used by public agencies to identify parts of a community that are most in need of investment.
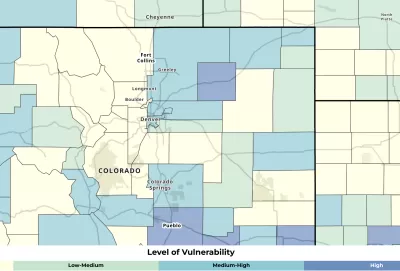
The Social Vulnerability Index (SVI) is a resource provided by the Centers for Disease Control and Prevention/Agency for Toxic Substances and Disease Registry (CDC/ATSDR). The SVI measures social vulnerability which is defined by CDC/ATSDR as the potential negative effects on communities caused by external stresses on human health.
The SVI is a valuable tool to identify communities that will most likely need support before, during and after a public health emergency. It uses 16 U.S. census variables to help local officials identify communities that may need support before, during, or after disasters. More broadly, SVI is an indicator of which areas of a community are considered “at risk” and most in need of investment to reduce vulnerability and increase overall health.
In this blog post, Austin Barrett of the National Recreation and Park Association (NRPA) highlights the SVI as a tool that can be used to help park and recreation agencies with their decision-making regarding future capital and operational investments. The SVI is one of the resources featured in NRPA's recently created Data and Mapping Resource Library which was previously discussed in in this article.
The use of vulnerability indicators is becoming more widespread as public agencies seek to identify and prioritize the most vulnerable areas and populations for planning, services, programs, and capital investments. For example, the Los Angeles County Department of Parks and Recreation (DPR) recently completed the Parks Needs Assessment Plus (PNA+) which uses indicators from the Healthy Places Index (HPI) and other data to identify where the most vulnerable residents are concentrated and determine which areas should be prioritized for conservation and restoration as well as regional and rural recreation.
FULL STORY: Featured Data Resource: Social Vulnerability Index


Planetizen Federal Action Tracker
A weekly monitor of how Trump’s orders and actions are impacting planners and planning in America.

Restaurant Patios Were a Pandemic Win — Why Were They so Hard to Keep?
Social distancing requirements and changes in travel patterns prompted cities to pilot new uses for street and sidewalk space. Then it got complicated.

Maui's Vacation Rental Debate Turns Ugly
Verbal attacks, misinformation campaigns and fistfights plague a high-stakes debate to convert thousands of vacation rentals into long-term housing.

In California Battle of Housing vs. Environment, Housing Just Won
A new state law significantly limits the power of CEQA, an environmental review law that served as a powerful tool for blocking new development.

Boulder Eliminates Parking Minimums Citywide
Officials estimate the cost of building a single underground parking space at up to $100,000.

Orange County, Florida Adopts Largest US “Sprawl Repair” Code
The ‘Orange Code’ seeks to rectify decades of sprawl-inducing, car-oriented development.
Urban Design for Planners 1: Software Tools
This six-course series explores essential urban design concepts using open source software and equips planners with the tools they need to participate fully in the urban design process.
Planning for Universal Design
Learn the tools for implementing Universal Design in planning regulations.
Heyer Gruel & Associates PA
JM Goldson LLC
Custer County Colorado
City of Camden Redevelopment Agency
City of Astoria
Transportation Research & Education Center (TREC) at Portland State University
Camden Redevelopment Agency
City of Claremont
Municipality of Princeton (NJ)