


A new mapping tool visualizes the unequal distribution of urban trees in U.S. cities.
An analysis from American Forests, a conservation nonprofit, has found glaring discrepancies in the availability of trees in low-income neighborhoods and communities of color, writes Linda Poon for Bloomberg CityLab. According to the study, "[n]eighborhoods with a majority of people of color have, on average, 33% less tree canopy than majority-white communities," while "[t]he poorest neighborhoods, where 90% of residents live in poverty, have 41% less coverage than the wealthiest ones."
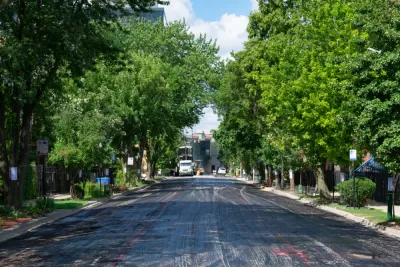
American Forests' new project, the Tree Equity Score map, highlights the difference in tree canopy across neighborhoods, indicating that this tracks closely with social and economic characteristics. "As Jad Daley, president and CEO of American Forests, told CityLab last August, any map of tree cover in a U.S. city likely reflects its racial and socioeconomic divide." As such, "the map is meant to be a tool for advocates and local officials. The score reflects how many trees are needed in each tract based on factors like the region’s climate and population density, as well as six equity measures: income level, employment rate, race, age distribution, health outcomes and the severity of the urban heat island effect."
"Nationally, some 522 million new trees are needed for every city to reach a score of 100, according to the analysis. That could lead to the creation of more than 3.8 million jobs, curb air pollution by 56,613 tons of particulates each year, and remove 9.3 million tons of carbon from the atmosphere — equivalent to 92 million cars, the analysis estimates. It could also generate roughly $5 billion in annual ecosystem service benefits, like air quality improvement and stormwater drainage."
The tool's creators hope that the map "could be particularly helpful to cities with fewer resources and smaller budgets to conduct their own tree canopy survey."
FULL STORY: The U.S. Neighborhoods With the Greatest Tree Inequity, Mapped


Planetizen Federal Action Tracker
A weekly monitor of how Trump’s orders and actions are impacting planners and planning in America.

Maui's Vacation Rental Debate Turns Ugly
Verbal attacks, misinformation campaigns and fistfights plague a high-stakes debate to convert thousands of vacation rentals into long-term housing.

San Francisco Suspends Traffic Calming Amidst Record Deaths
Citing “a challenging fiscal landscape,” the city will cease the program on the heels of 42 traffic deaths, including 24 pedestrians.

Amtrak Rolls Out New Orleans to Alabama “Mardi Gras” Train
The new service will operate morning and evening departures between Mobile and New Orleans.

The Subversive Car-Free Guide to Trump's Great American Road Trip
Car-free ways to access Chicagoland’s best tourist attractions.

San Antonio and Austin are Fusing Into one Massive Megaregion
The region spanning the two central Texas cities is growing fast, posing challenges for local infrastructure and water supplies.
Urban Design for Planners 1: Software Tools
This six-course series explores essential urban design concepts using open source software and equips planners with the tools they need to participate fully in the urban design process.
Planning for Universal Design
Learn the tools for implementing Universal Design in planning regulations.
Heyer Gruel & Associates PA
JM Goldson LLC
Custer County Colorado
City of Camden Redevelopment Agency
City of Astoria
Transportation Research & Education Center (TREC) at Portland State University
Jefferson Parish Government
Camden Redevelopment Agency
City of Claremont