


The U.S. is exceptional when it comes to carbon emissions—that much is indisputable.
Umair Irfan boosts the signal on a report published in April by Carbon Brief, which calculated the cumulative carbon emissions of every country since 1750.
"What’s abundantly clear," according to Irfan's explanation of the Carbon Brief's analysis, "is that the United States of America is the all-time biggest, baddest greenhouse gas emitter on the planet."
The Carbon Brief team also created a graph that tracks each country's carbon output since 1750.
Animation: The countries with the largest cumulative CO2 emissions since 1750
Ranking as of the start of 2019:
1) US – 397GtCO2
2) CN – 214Gt
3) fmr USSR – 180
4) DE – 90
5) UK – 77
6) JP – 58
7) IN – 51
8) FR – 37
9) CA – 32
10) PL – 27 pic.twitter.com/cKRNKO4O0b— Carbon Brief (@CarbonBrief) April 23, 2019
For more topical assessment of the world's current carbon emissions, see the "Global Carbon Budget" released this week by the Global Carbon Project, which finds the world's carbon emissions reaching a new high in 2019. The United Nations also last week released a report pinning much of the blame for climate change on the 20th century history of land use and transportation planning in the United States.
FULL STORY: Why the US bears the most responsibility for climate change, in one chart

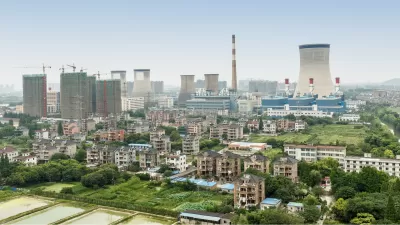
China's Climate Change Paradox
President Xi Jinping wants China to replace the U.S. as the world's leader in fighting climate change, yet emissions from China are projected to increase at a higher rate than any other major emitter, according to the Global Carbon Project.
Studies: 2013 Worldwide Carbon Emissions Higher than Ever
World leaders gathering today in New York City for a United Nations climate summit will be greeted by the news that the world is doing worse than ever in reducing carbon emissions.
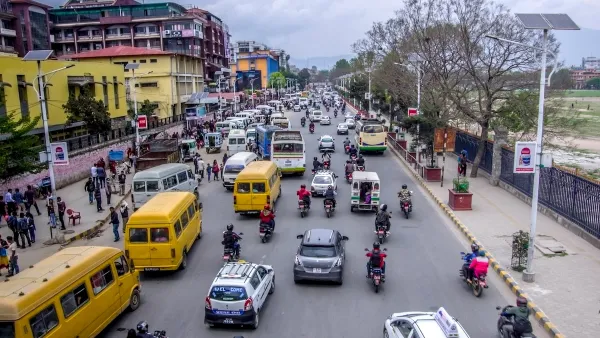
The Small South Asian Republic Going all in on EVs
Thanks to one simple policy change less than five years ago, 65% of new cars in this Himalayan country are now electric.

Maui's Vacation Rental Debate Turns Ugly
Verbal attacks, misinformation campaigns and fistfights plague a high-stakes debate to convert thousands of vacation rentals into long-term housing.

Planetizen Federal Action Tracker
A weekly monitor of how Trump’s orders and actions are impacting planners and planning in America.

San Francisco Suspends Traffic Calming Amidst Record Deaths
Citing “a challenging fiscal landscape,” the city will cease the program on the heels of 42 traffic deaths, including 24 pedestrians.

Defunct Pittsburgh Power Plant to Become Residential Tower
A decommissioned steam heat plant will be redeveloped into almost 100 affordable housing units.

Trump Prompts Restructuring of Transportation Research Board in “Unprecedented Overreach”
The TRB has eliminated more than half of its committees including those focused on climate, equity, and cities.

Amtrak Rolls Out New Orleans to Alabama “Mardi Gras” Train
The new service will operate morning and evening departures between Mobile and New Orleans.
Urban Design for Planners 1: Software Tools
This six-course series explores essential urban design concepts using open source software and equips planners with the tools they need to participate fully in the urban design process.
Planning for Universal Design
Learn the tools for implementing Universal Design in planning regulations.
Heyer Gruel & Associates PA
JM Goldson LLC
Custer County Colorado
City of Camden Redevelopment Agency
City of Astoria
Transportation Research & Education Center (TREC) at Portland State University
Jefferson Parish Government
Camden Redevelopment Agency
City of Claremont