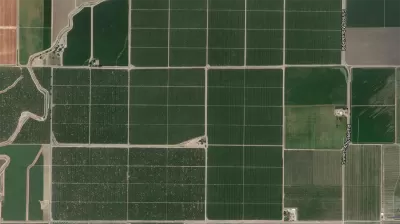
Facebook expects to release its worldwide maps of human density in the coming months—potential applications will likely be somewhere on the spectrum between humanitarian and commercial.

James Vincent reports on Facebook's project to map the world's population density using artificial intelligence (AI), which the social media company launched in 2016.
Vincent's coverage follows a blog post from Facebook updating progress for the project.
As Facebook explains, creating maps like this is a challenging job for humans. Although we have high-resolution satellite imagery that covers pretty much every corner of the globe, turning this into useful information is a time-consuming process. To create population density maps, for example, humans have to label each building in the images, then cross-reference this with census data. This is particularly tricky in the African continent where census tracts can cover regions as large as 150,000 square miles but contain just 55,000 people.
Facebook is hacking the tedium of the project of mapping the world with the help of AI. "To automate this process, Facebook’s engineers used data from open-source mapping project Open Street Map to train a computer vision system that can recognize buildings in satellite imagery. They then used this to remove the vast majority of the satellite data that showed unoccupied land," according to Vincent.
Facebook's post emphasizes potential humanitarian applications for the mapping project. Vincent, however, suggests that the maps have obvious commercial applications as well.
FULL STORY: Facebook is using AI to map population density around the world

Maui's Vacation Rental Debate Turns Ugly
Verbal attacks, misinformation campaigns and fistfights plague a high-stakes debate to convert thousands of vacation rentals into long-term housing.

Planetizen Federal Action Tracker
A weekly monitor of how Trump’s orders and actions are impacting planners and planning in America.

San Francisco Suspends Traffic Calming Amidst Record Deaths
Citing “a challenging fiscal landscape,” the city will cease the program on the heels of 42 traffic deaths, including 24 pedestrians.

Defunct Pittsburgh Power Plant to Become Residential Tower
A decommissioned steam heat plant will be redeveloped into almost 100 affordable housing units.

Trump Prompts Restructuring of Transportation Research Board in “Unprecedented Overreach”
The TRB has eliminated more than half of its committees including those focused on climate, equity, and cities.

Amtrak Rolls Out New Orleans to Alabama “Mardi Gras” Train
The new service will operate morning and evening departures between Mobile and New Orleans.
Urban Design for Planners 1: Software Tools
This six-course series explores essential urban design concepts using open source software and equips planners with the tools they need to participate fully in the urban design process.
Planning for Universal Design
Learn the tools for implementing Universal Design in planning regulations.
Heyer Gruel & Associates PA
JM Goldson LLC
Custer County Colorado
City of Camden Redevelopment Agency
City of Astoria
Transportation Research & Education Center (TREC) at Portland State University
Jefferson Parish Government
Camden Redevelopment Agency
City of Claremont


