


The Lawrence Livermore National Laboratory has a collection of infographics illustrating the use and waste of energy in the county and in specific states by year.
A tweet by the U.S. Department of Energy brought our attention to this collection of "Energy Flow Charts' on the website of the Lawrence Livermore National Laboratory.
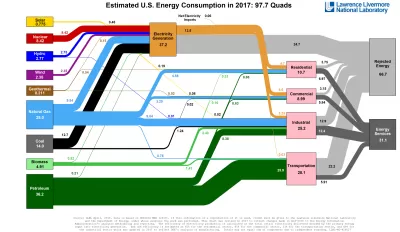
One thing that becomes exceedingly clear is how wasteful the entire energy industry is by the time its product gets down to the end user. In the fine print of the 2017 flow chart for the United States, we see that end user efficiency is calculated at 65 percent for the residential sector, 65 percent for the commercial sector, 49 percent for the industrial sector, and 21 percent for the transportation sector.
FULL STORY: Energy Flow Charts


How Smart Street Lights Can Help Cities Achieve Sustainability Goals
Switching to energy-efficient LEDs and using tech to program when and how street lighting operates can save cities millions in electricity expenses and bring down carbon emissions.

New Jersey to Consider Charging Fossil Fuel Companies for Pollution
A proposed law would make companies liable for damages caused by burning fossil fuels.

Housing as a Climate Resilience Strategy
Ensuring that housing, including in informal settlements, is safe and healthy for its residents is a key tool in the fight to build more sustainable and equitable communities in the face of climate migration.

Planetizen Federal Action Tracker
A weekly monitor of how Trump’s orders and actions are impacting planners and planning in America.

Chicago’s Ghost Rails
Just beneath the surface of the modern city lie the remnants of its expansive early 20th-century streetcar system.

San Antonio and Austin are Fusing Into one Massive Megaregion
The region spanning the two central Texas cities is growing fast, posing challenges for local infrastructure and water supplies.

Since Zion's Shuttles Went Electric “The Smog is Gone”
Visitors to Zion National Park can enjoy the canyon via the nation’s first fully electric park shuttle system.

Trump Distributing DOT Safety Funds at 1/10 Rate of Biden
Funds for Safe Streets and other transportation safety and equity programs are being held up by administrative reviews and conflicts with the Trump administration’s priorities.

German Cities Subsidize Taxis for Women Amid Wave of Violence
Free or low-cost taxi rides can help women navigate cities more safely, but critics say the programs don't address the root causes of violence against women.
Urban Design for Planners 1: Software Tools
This six-course series explores essential urban design concepts using open source software and equips planners with the tools they need to participate fully in the urban design process.
Planning for Universal Design
Learn the tools for implementing Universal Design in planning regulations.
planning NEXT
Appalachian Highlands Housing Partners
Mpact (founded as Rail~Volution)
City of Camden Redevelopment Agency
City of Astoria
City of Portland
City of Laramie