


This "livable cities" ranking considers transit, walkability, and bikeability.

In response to the many, many attempts to rank cities, I decided a decade ago to create my own "livable city rankings." The rankings addressed crime, transit use, and walkability, and concluded (not surprisingly) that New York was the most livable city if housing costs were not a factor. When I considered housing costs, Ann Arbor came in first.
A decade has passed, and it occurred to me to see if anything has changed But rather than using the same methods, I decided to include a variety of different factors, to reflect some of the responses to my first attempt. I decided to use a simple measure of crime; rather than weighing multiple types of crime, I merely double-weighted murder I did this for two reasons. First, I suspect that homicide is more likely to be reported to the police than, say, a burglary or purse-snatching. Second, it seems to me that focusing on the most major crime sharpens the distinction between the most troubled cities and the rest of the United States. However, this method does have one negative side effect: it required me to focus on major cities, since most suburbs and small towns have very few murders. By contrast, the old method allowed me to compare suburbs to each other.
I also shifted my transit and walkability measurements. Originally, I used three measurements: transit mode share as a percentage of the poverty rate (to avoid favoring cities where people used transit because they are poor rather than because transit service is excellent), transit mode share, and walking mode share. I kept the first measurement as a method of measuring transit. But the rise of Walk Score allowed me to change the last two measurements: I substituted citywide Bike Score and Walk Score measurements for mode share data; Bikescore allows me to consider the interests of cyclists, and Walkscore allows me to weigh walkability in contexts unrelated to commuting. On the other hand, I lost something by using these measurements: smaller cities and suburbs often don't have a Bike Score or Walk Score.
Finally, I decided to weigh cost of living a little differently. In addition to including the ratio between home prices and incomes, I also included data on rents (from this study comparing Craigslist ads in various cities). Using rent data had one negative side effect: the study only includes the 50 or so largest metros, so smaller cities like Ann Arbor and Little Rock got deleted.
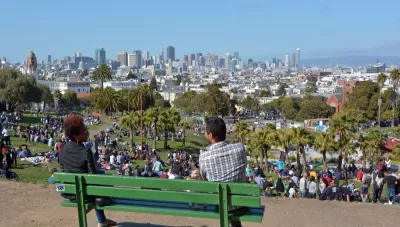
My results are on this website, and were slightly different from a decade ago. Without cost of living, San Francisco beat New York by a razor-thin margin: the former city's superior Bike Score pushed it over the top. Boston was a solid third. Seattle was a surprise fourth-place finisher, combining adequate grades on the "car-free" indicia (transit/walking/biking) with crime rates lower than those of other transit metropolises.
What happened when I gave my two cost of living factors (rent, home costs) equal weight with crime and walkability? Seattle was a surprise first-place finisher, and Minneapolis and Salt Lake City an even more surprising second and third, respectively. These cities were not superlative in any way, but performed adequately in every category while New York and San Francisco were dragged down by housing costs. Last place was a much easier call. Birmingham, Alabama finished last both with and without cost of living—high crime and poor transit were a deadly combination.


More Evidence for a Link Between Transit and Home Values
Judging from a statistical analysis by Redfin, there is in fact a positive correlation between home values and transit access. But that only applies in areas where transit and walking are already common modes.
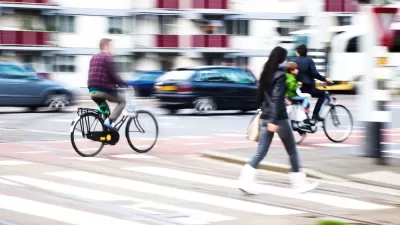
20 Safest and Most Dangerous US Cities for Pedestrians
Pedestrian safety is a vital component to a walkable city. Which large cities in the United States have a leg up, and which are trailing behind?

The Problem With All Those 'Livability' Rankings
Why is it that smallish cities in western Europe always score so well? Perhaps the underlying assumptions behind ostensibly data-driven "livability" rankings cater to a certain audience and leave most of us out.

Planetizen Federal Action Tracker
A weekly monitor of how Trump’s orders and actions are impacting planners and planning in America.

Congressman Proposes Bill to Rename DC Metro “Trump Train”
The Make Autorail Great Again Act would withhold federal funding to the system until the Washington Metropolitan Area Transit Authority (WMATA), rebrands as the Washington Metropolitan Authority for Greater Access (WMAGA).

DARTSpace Platform Streamlines Dallas TOD Application Process
The Dallas transit agency hopes a shorter permitting timeline will boost transit-oriented development around rail stations.

San Francisco's School District Spent $105M To Build Affordable Housing for Teachers — And That's Just the Beginning
SFUSD joins a growing list of school districts using their land holdings to address housing affordability challenges faced by their own employees.

Car-Centric LA Suburb Looks to a Train-Oriented Future
City leaders in Rancho Cucamonga, the future western terminus of the Brightline West rail line to Las Vegas, want to reimagine the city as a transit-oriented, pedestrian-friendly community.

New Alaska Bitcoin Mine Would Burn as Much Energy as the State’s Largest Coal Plant
Fueled by “stranded” natural gas, the startup hopes to become the largest in the US, and to make Alaska an industry center.
Urban Design for Planners 1: Software Tools
This six-course series explores essential urban design concepts using open source software and equips planners with the tools they need to participate fully in the urban design process.
Planning for Universal Design
Learn the tools for implementing Universal Design in planning regulations.
Municipality of Princeton
Roanoke Valley-Alleghany Regional Commission
City of Mt Shasta
City of Camden Redevelopment Agency
City of Astoria
Transportation Research & Education Center (TREC) at Portland State University
US High Speed Rail Association
City of Camden Redevelopment Agency
Municipality of Princeton (NJ)