


An analysis of the geographic distribution of New York's new public plazas sought to determine if the program was meeting one of its stated goals: providing access to public plazas for low- and moderate-income households.
The NYC Plaza Program has set some lofty goals for the creation of new public spaces in the city. Writing in the Placemeter blog, Natalie Kunstadter took on the challenge of determining if the program is meeting one of its stated goals, by providing access to the new public plazas to households with low and moderate incomes. Using census data and location data for the new plazas provided by the city, Kunstadter's geospatial analysis looked at the proximity of target households to the plazas.
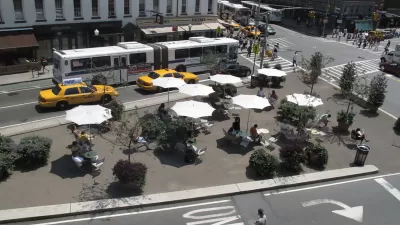
The Plaza Program wants to ensure that all New Yorkers are within a 10-minute walk of green space, so I analyzed the area within a 10-minute walk of each of the project sites. A quick internet search told me that a standard conversion for this walk was 800 meters, so I created an 800-meter buffer around each plaza. I then did a spatial join between the new polygons and the census/income polygons to find the average of the median household income that fell within a 10-minute walk of each plaza.
Kunstadter's analysis, detailed both in map and histogram form, found that approximately 54 percent of the new plazas were situated in areas that served low-income residents, meaning the program was achieving its stated goal for equal access. However she does seem room for improvement in the model, including giving weight to the population density in each tract. Better data analysis could potentially aid the program in placing future plazas in areas that need them.
[The article was updated with the correct spelling of the author's name.]
FULL STORY: Plazas For The People: A Geospatial Analysis Of The NYC Plaza Program

Even Parks Are Going Online During the Pandemic
Parks departments in New York City and Pittsburgh are offering videos and livestreams to cooped-up residents.
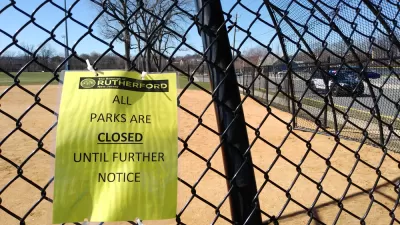
Frontlines of the Social Distancing Effort Shifts to Parks and Open Space
Too many people have been seeking normalcy on parks and on trails. This isn’t a normal time.
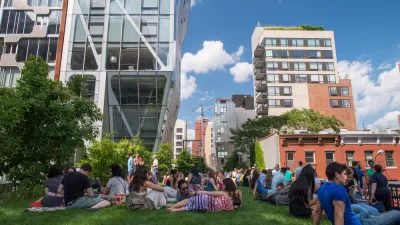
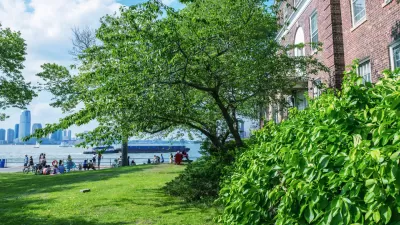
Ten Years of the High Line—Time to Reflect
As the High Line turns ten, a debate about the costs and benefits of urban revitalization continues.

Planetizen Federal Action Tracker
A weekly monitor of how Trump’s orders and actions are impacting planners and planning in America.

Chicago’s Ghost Rails
Just beneath the surface of the modern city lie the remnants of its expansive early 20th-century streetcar system.
San Antonio and Austin are Fusing Into one Massive Megaregion
The region spanning the two central Texas cities is growing fast, posing challenges for local infrastructure and water supplies.

Since Zion's Shuttles Went Electric “The Smog is Gone”
Visitors to Zion National Park can enjoy the canyon via the nation’s first fully electric park shuttle system.

Trump Distributing DOT Safety Funds at 1/10 Rate of Biden
Funds for Safe Streets and other transportation safety and equity programs are being held up by administrative reviews and conflicts with the Trump administration’s priorities.

German Cities Subsidize Taxis for Women Amid Wave of Violence
Free or low-cost taxi rides can help women navigate cities more safely, but critics say the programs don't address the root causes of violence against women.
Urban Design for Planners 1: Software Tools
This six-course series explores essential urban design concepts using open source software and equips planners with the tools they need to participate fully in the urban design process.
Planning for Universal Design
Learn the tools for implementing Universal Design in planning regulations.
planning NEXT
Appalachian Highlands Housing Partners
Mpact (founded as Rail~Volution)
City of Camden Redevelopment Agency
City of Astoria
City of Portland
City of Laramie